
- Despite the red flag hinted at by the daily MACD's negative territory, buying momentum continues to strengthen.
- The hourly RSI and MACD reveal a consolidation phase in the market, indicating a temporary equilibrium between buyers and sellers.
- The short-term outlook favors the bulls as sellers failed to consolidate below the 20-day SMA.
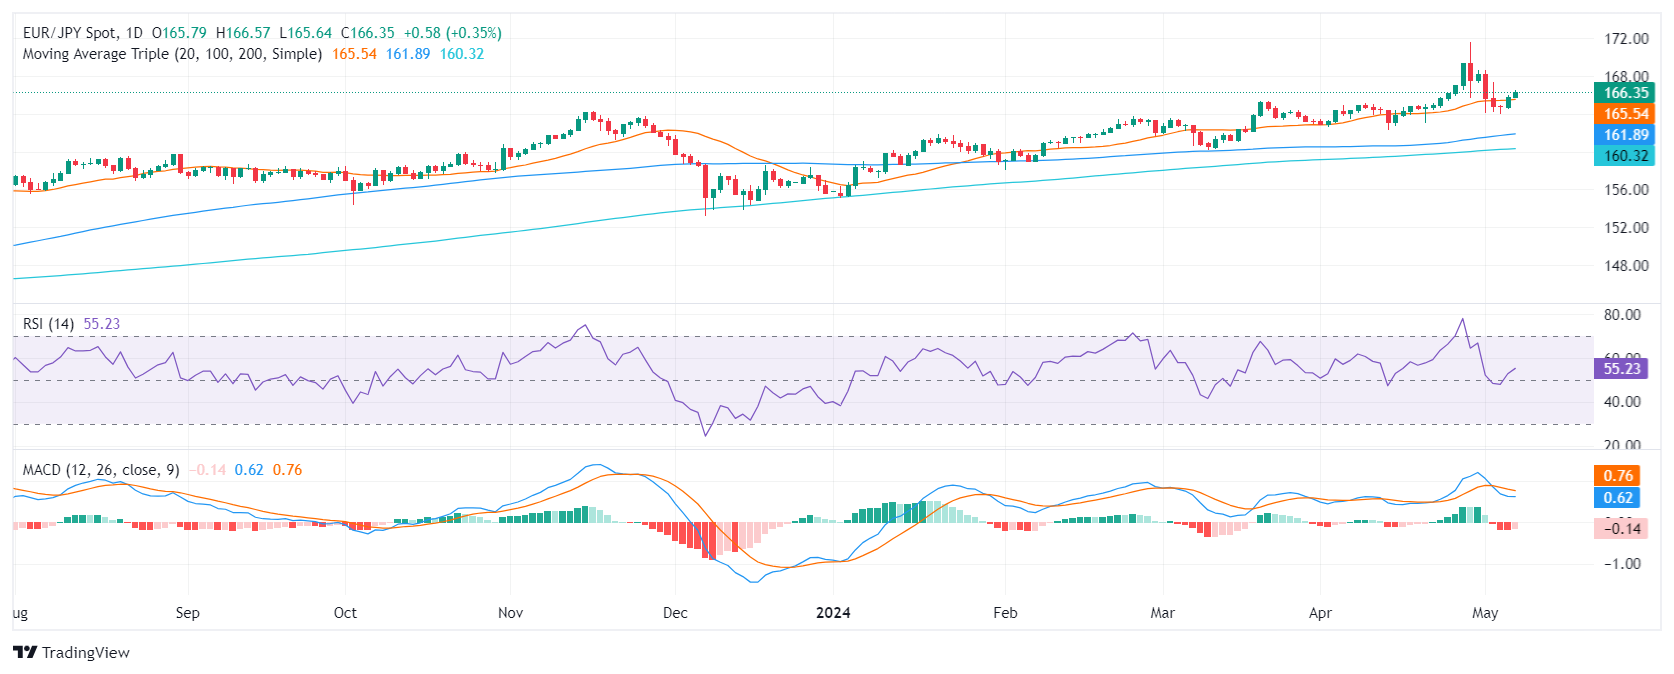
On Tuesday, EUR/JPY rose 0.36% to 166.35 and managed to position itself above the key 20-day SMA, which alludes to the predominant power of bulls in the current market. Indicators on the daily chart improved, while buyers appear to consolidate gains on the hourly chart….
On the daily chart, the RSI for EUR/JPY is showing a positive trend. The recovery of the RSI from below 50 to 59 is forming a slightly bullish picture. Furthermore, the moving average convergence divergence (MACD) shows weak selling traction, with falling red bars.
EUR/JPY daily chart
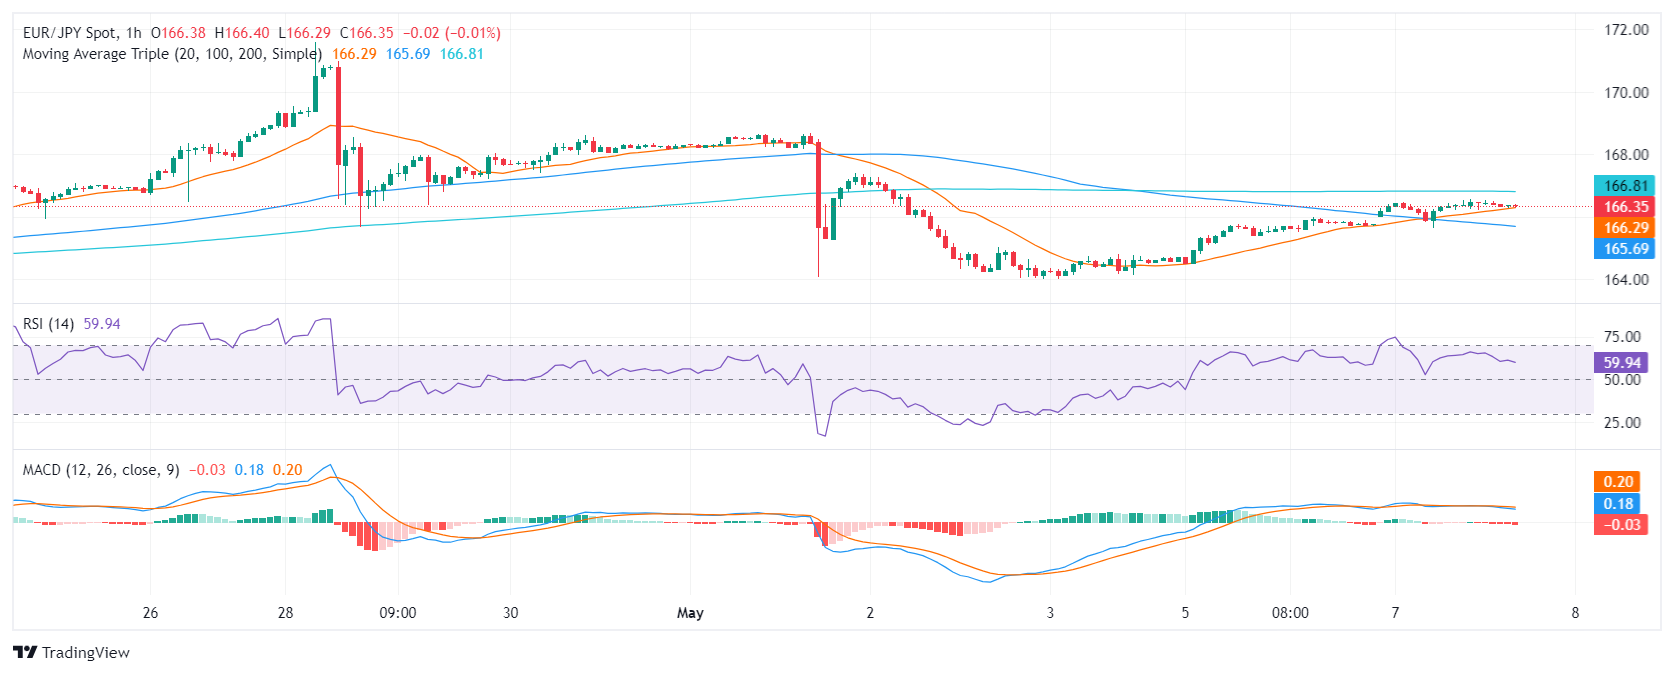
Comparatively, the hourly chart shows a slightly different picture. The hourly RSI shows a fluctuating movement, somewhere between positive territory. The most recent reading of 59 suggests a balance between buyers and sellers. This relatively flat level of the RSI suggests a consolidation phase. However, the MACD histogram remains stationary, printing flat red bars and emphasizing the lack of strong momentum on both sides of the market.
EUR/JPY hourly chart
From a broader market perspective, EUR/JPY has exhibited a strong bullish stance. The pair has risen above its 20-day SMA, reinforcing the trend as it is also above the 100-day and 200-day SMA.
In summary, while the daily RSI suggests strength among buyers, the stagnant hourly RSI and the stable, negative MACD indicate current market stagnation or consolidation. However, the positioning of the SMAs underlines a strong bullish momentum in the short-to-long-term scenario for EUR/JPY. If buyers secure the recovery of the 20-day SMA, the cross could be poised to retest the cycle highs above 171.00.
Source: Fx Street
I am Joshua Winder, a senior-level journalist and editor at World Stock Market. I specialize in covering news related to the stock market and economic trends. With more than 8 years of experience in this field, I have become an expert in financial reporting.


