
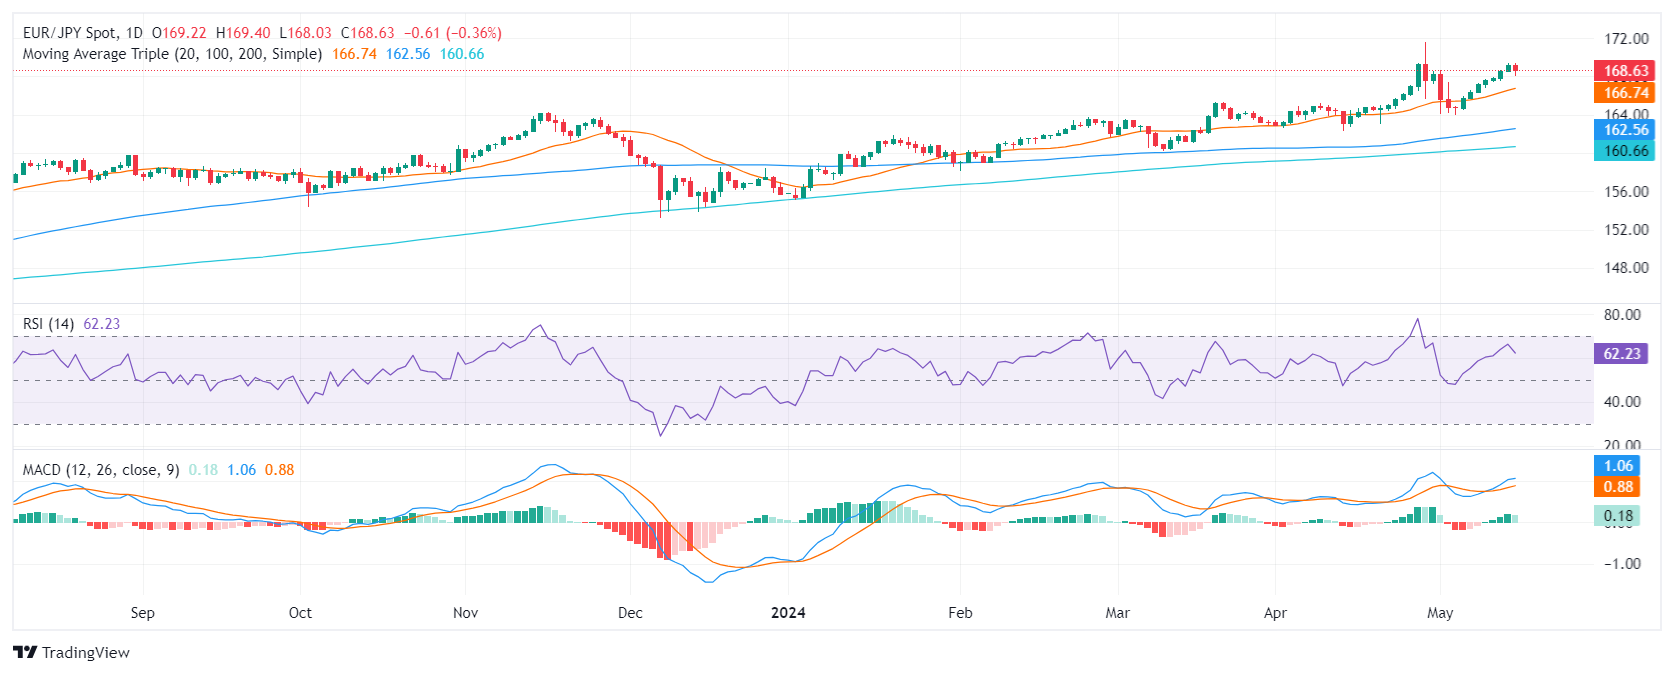
- The daily RSI shows strong buying momentum, in a positive zone.
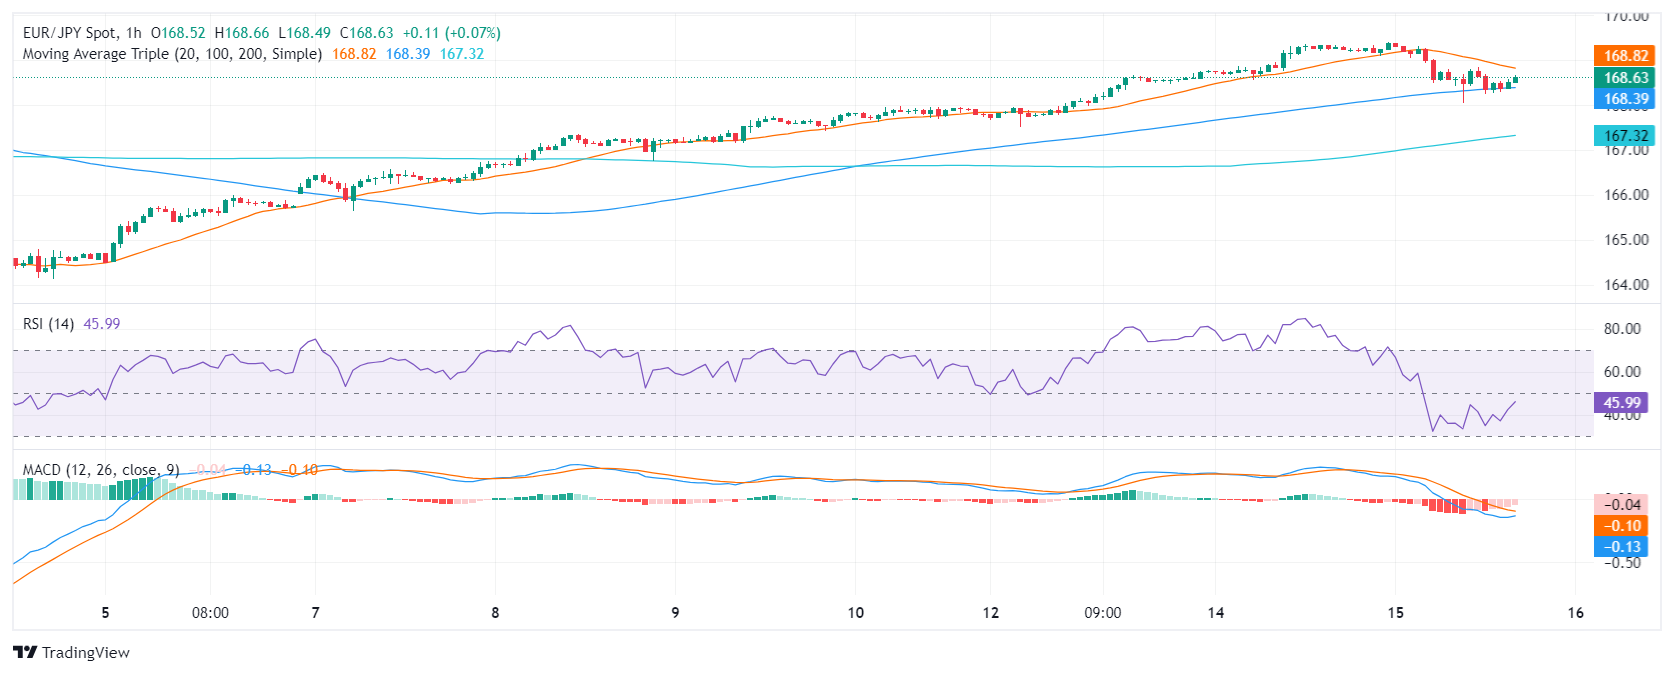
- The hourly chart shows a contrast, as the RSI falls into the negative zone and the MACD shows flat red bars, indicating short-term selling traction.
- As the pair approached cycle highs, a pause in momentum seemed likely before a retest.
In the Wednesday session, the EUR/JPY pair maintains solid bullish momentum, despite encountering selling pressure and retreating to 168.63. Although it touched highs around 170.00, investors temporarily paused which could indicate short-term consolidation and this pause could pave the way for further upward moves.
On the daily chart, the RSI is in positive territory, reflecting bullish momentum from the bulls but points downward, indicating the aforementioned break in bullish traction.
EUR/JPY daily chart
The hourly chart, on the other hand, presents a weaker picture. The RSI fell into negative territory with the latest reading at 45. The moving average convergence divergence (MACD) remains bearish, with flat red bars, suggesting short-term selling pressure. However, the indicators appear to be recovering in this framework ahead of the Asian session.
EUR/JPY hourly chart
As for EUR/JPY, it is in a bullish position in the short and long term, as it remains above the 20, 100 and 200-day SMAs. This stance suggests strong bullish momentum for the pair, poised to continue higher.
In conclusion, although the overall technical outlook for EUR/JPY remains bullish based on the analysis of the SMAs and the daily chart, the extent of the correction needs to be monitored. Still, any move that keeps the pair above its main SMAs would not threaten the positive outlook.
Source: Fx Street
I am Joshua Winder, a senior-level journalist and editor at World Stock Market. I specialize in covering news related to the stock market and economic trends. With more than 8 years of experience in this field, I have become an expert in financial reporting.


