
- EUR/JPY adds to Thursday’s sharp pullback and tests 157.30.
- Immediately to the downside is the weekly low near 156.80.
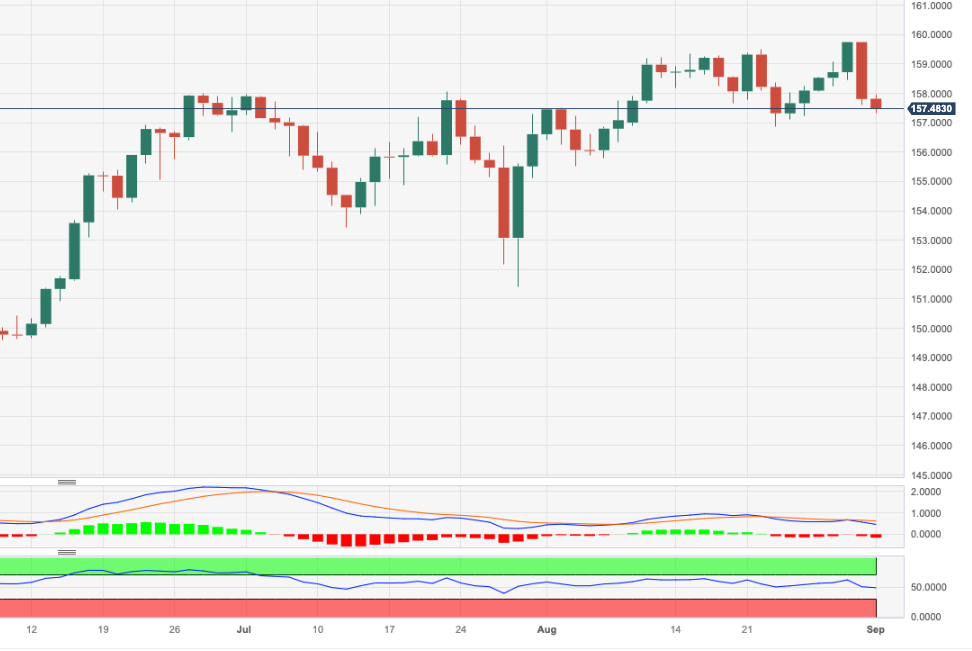
Greater selling pressure would force the USD/JPY to add up Thursday’s losses and print multi-day lows near 157.30 on Friday.
Should the downside bias pick up, the cross risks an initial slide to minor support at the weekly low of 156.86 (August 23), which so far appears to be propped up by the interim 55-day SMA (156.90).
For now, the long-term positive outlook for the cross looks favored as long as it remains above the 200-day SMA, today at 147.98.
EUR/JPY daily chart
Source: Fx Street
I am Joshua Winder, a senior-level journalist and editor at World Stock Market. I specialize in covering news related to the stock market and economic trends. With more than 8 years of experience in this field, I have become an expert in financial reporting.


