
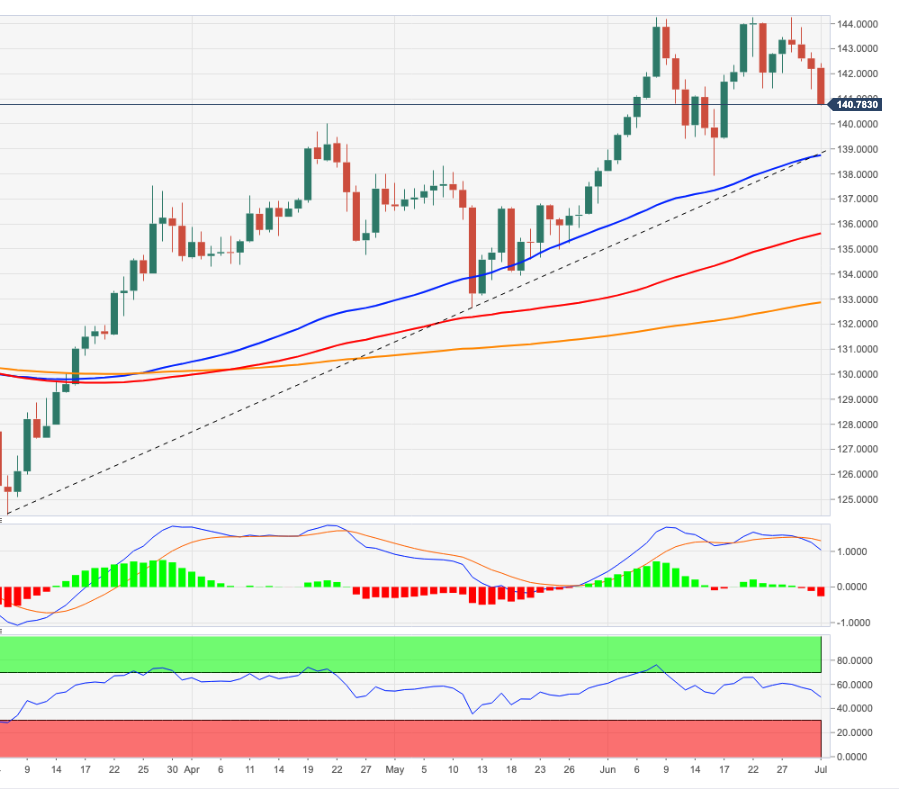
- EUR/JPY continues to slide and breaks 141.00 to multi-session lows.
- The next move down is the June low at 137.86 (June 15).
The EUR/JPY remains under selling pressure and hits fresh 2-week lows below 141.00 on Friday.
Despite the ongoing correction, the bullish bias of the cross holds well as the support line around 138.70 caps the downside. This containment zone is currently reinforced by the 55-day SMA.
However, the current bearish move carries the potential to revisit the June low at 137.86 recorded on June 15, where the downside is expected to hold.
EUR/JPY daily chart
Technical levels
Source: Fx Street
With 6 years of experience, I bring to the table captivating and informative writing in the world news category. My expertise covers a range of industries, including tourism, technology, forex and stocks. From brief social media posts to in-depth articles, I am dedicated to creating compelling content for various platforms.


