
- EUR/JPY extends Tuesday’s bounce from the 133.40 area.
- The 200-day moving average, located near 133.70, maintains the downward trend so far.
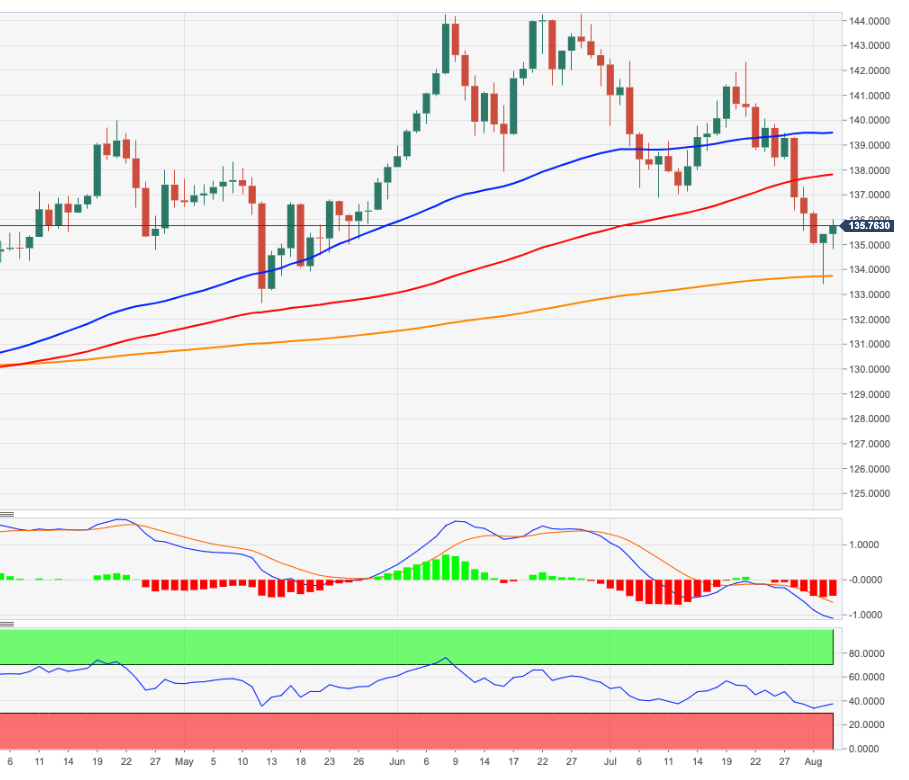
EUR/JPY extends the rebound to the limits of 136.00 after bottoming near the 200-day simple moving average on Tuesday (133.71).
At the moment, the cross looks set to move higher, with intermediate hurdles at the 100 and 55-day simple moving average at 137.78 and 139.45, respectively.
As long as it is above the 200 SMA, the outlook for the cross is expected to remain constructive.
EUR/JPY day chart
Source: Fx Street
With 6 years of experience, I bring to the table captivating and informative writing in the world news category. My expertise covers a range of industries, including tourism, technology, forex and stocks. From brief social media posts to in-depth articles, I am dedicated to creating compelling content for various platforms.


