
- EUR/JPY looks offered after two consecutive daily advances.
- Next up is the August high at 138.40.
The EUR/JPY corrects lower after hitting weekly resistance just below 138.00 on Aug 17.
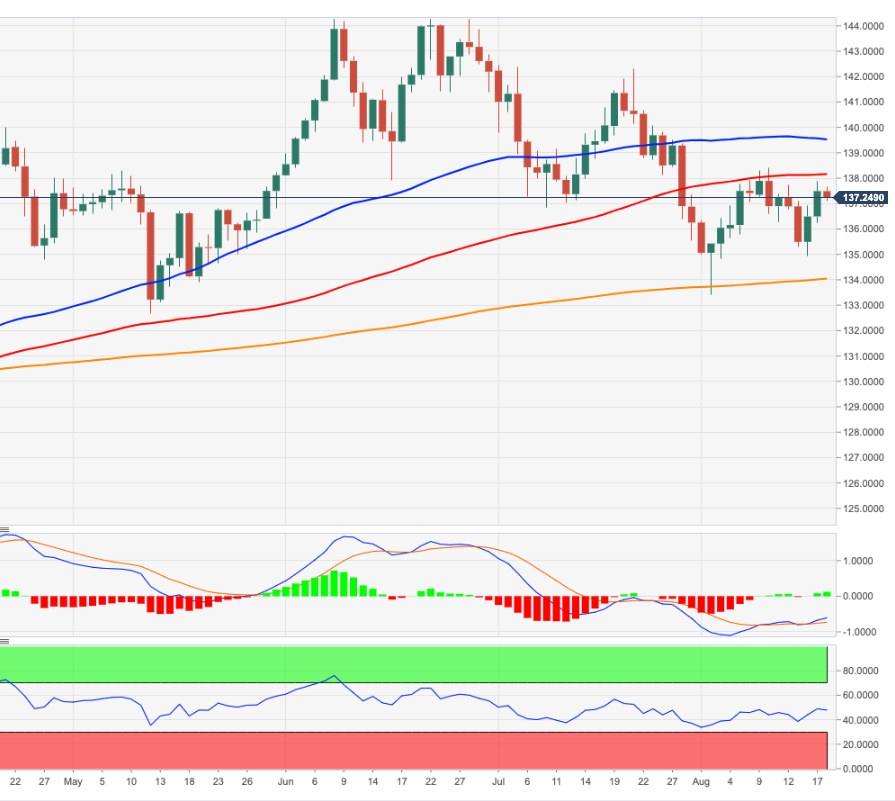
Should the recovery be more serious, the cross should meet the next barrier at the 100-Day SMA at 138.13 before the more relevant August high at 138.39 (Aug 10). Rises are expected to gain further momentum once this latest barrier is cleared.
As long as it is above the 200-day SMA, today at 134.01, the outlook for the pair should remain constructive.
EUR/JPY daily chart
Technical levels
Source: Fx Street
With 6 years of experience, I bring to the table captivating and informative writing in the world news category. My expertise covers a range of industries, including tourism, technology, forex and stocks. From brief social media posts to in-depth articles, I am dedicated to creating compelling content for various platforms.


