
- EUR/JPY is positioned within a rising wedge pattern, signaling a possible bearish reversal.
- The 14-day RSI indicates that the currency asset is in an overbought condition.
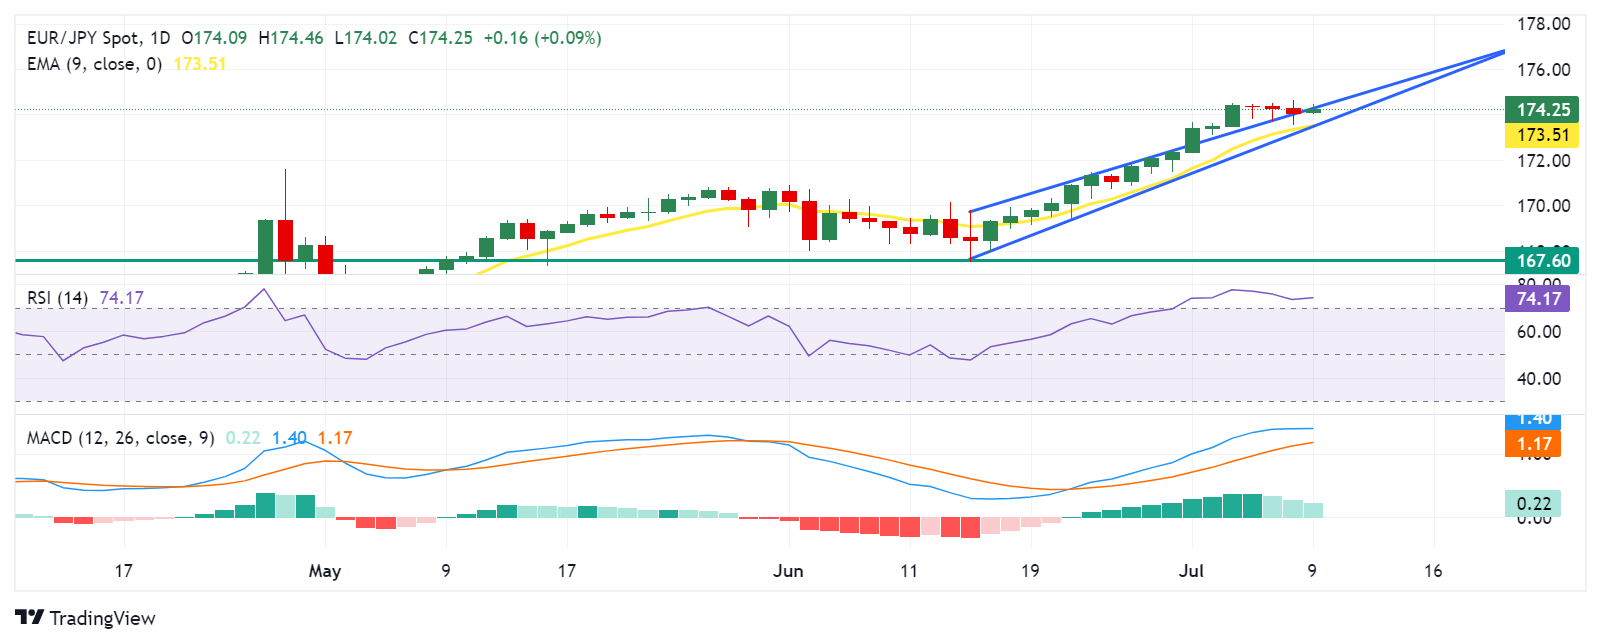
- The upper boundary of the ascending wedge around the 174.40 level acts as immediate resistance.
EUR/JPY halts its three-day losing streak, trading around 174.30 during European hours on Tuesday. The daily chart analysis shows a rising wedge pattern, indicating a possible bearish reversal. Moreover, the 14-day Relative Strength Index (RSI) is above the 70 level, suggesting that the currency asset is overbought and could face a correction.
The Moving Average Convergence Divergence (MACD) momentum indicator is currently above both the center line and the signal line, indicating a confirmation of bullish momentum. Traders can anticipate further moves by watching for possible changes in momentum in the EUR/JPY pair.
The EUR/JPY pair is facing a potential resistance near the upper boundary of the ascending wedge around the level of 174.40. A successful breakout above this level could strengthen the bullish bias and lead the pair towards the psychological level of 175.00.
On the downside, key support appears around the nine-day exponential moving average (EMA) at 173.52, followed by the lower boundary of the ascending wedge around the 173.50 level. A break below the latter could put downward pressure on the EUR/JPY pair to navigate the region around the psychological 170.00 level.
Further decline could increase selling pressure on the EUR/JPY pair to navigate the vicinity around the retracement support at 167.60.
EUR/JPY: Daily Chart
Euro PRICE Today
The table below shows the exchange rate of the Euro (EUR) against major currencies today. The Euro was the strongest currency against the New Zealand Dollar.
| USD | EUR | GBP | JPY | CAD | AUD | NZD | CHF | |
|---|---|---|---|---|---|---|---|---|
| USD | 0.02% | -0.02% | 0.08% | 0.00% | -0.04% | 0.12% | 0.00% | |
| EUR | -0.02% | -0.05% | 0.07% | -0.03% | -0.06% | 0.10% | -0.02% | |
| GBP | 0.02% | 0.05% | 0.12% | 0.02% | 0.01% | 0.15% | 0.02% | |
| JPY | -0.08% | -0.07% | -0.12% | -0.10% | -0.14% | 0.00% | -0.11% | |
| CAD | -0.00% | 0.03% | -0.02% | 0.10% | -0.06% | 0.13% | -0.01% | |
| AUD | 0.04% | 0.06% | -0.01% | 0.14% | 0.06% | 0.14% | 0.00% | |
| NZD | -0.12% | -0.10% | -0.15% | -0.01% | -0.13% | -0.14% | -0.12% | |
| CHF | -0.00% | 0.02% | -0.02% | 0.11% | 0.01% | -0.00% | 0.12% |
The heatmap shows percentage changes of major currencies. The base currency is selected from the left column, while the quote currency is selected from the top row. For example, if you choose the Euro from the left column and move along the horizontal line to the US Dollar, the percentage change shown in the chart will represent EUR (base)/USD (quote).
Source: Fx Street
I am Joshua Winder, a senior-level journalist and editor at World Stock Market. I specialize in covering news related to the stock market and economic trends. With more than 8 years of experience in this field, I have become an expert in financial reporting.


