
- EUR/JPY adds to the negative start of the week and tests 162.20.
- Additional losses could revisit the 161.20 area in the near term.
He EUR/JPY corrects further lower and falls to four-day lows around the 162.20 area on Tuesday.
The continuation of the bearish bias carries the potential to drag the cross to the weekly low of 161.20/25 (Nov 21) before the provisional 55-day SMA, today at 159.40.
For now, the positive long-term outlook for the cross seems favored as long as it remains above the 200-day SMA at 153.37.
EUR/JPY Daily Chart
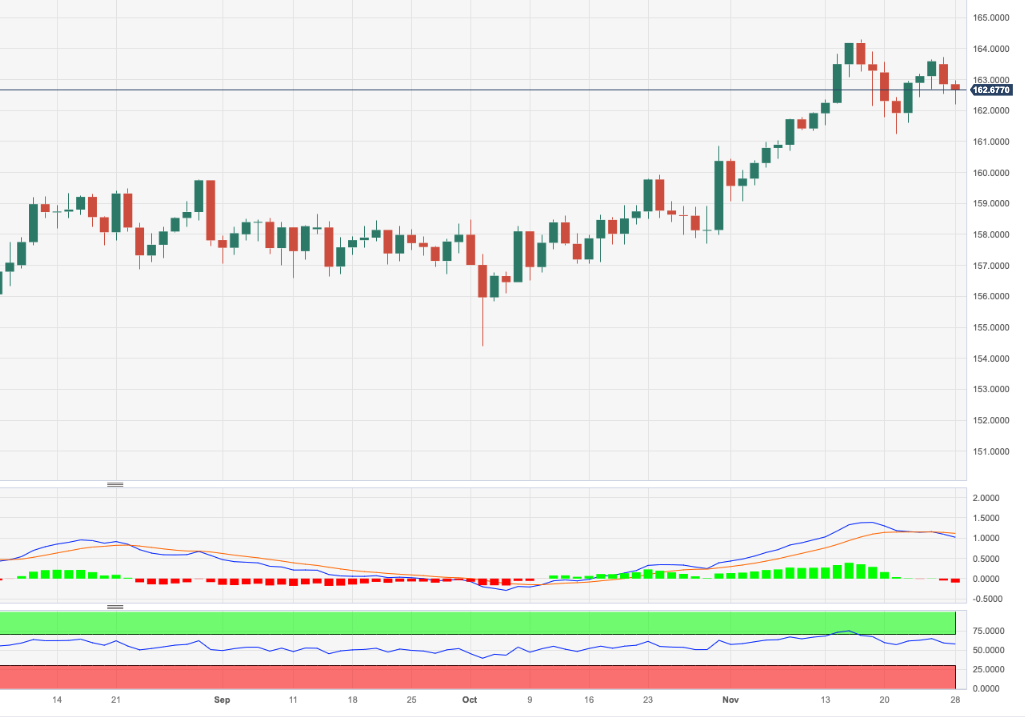
Source: Fx Street
I am Joshua Winder, a senior-level journalist and editor at World Stock Market. I specialize in covering news related to the stock market and economic trends. With more than 8 years of experience in this field, I have become an expert in financial reporting.


