
- EUR/JPY adds to Monday’s losses and challenges 137.00.
- Immediately to the downside, the 100-day SMA emerges.
The EUR/JPY bearish tone remains unchanged in the second half of the week so far.
As long as it is below the 4-month resistance line around 140.00, further losses should remain on the table with the initial target at the 100-Day SMA today at 136.16. Losing these levels exposes a deeper pullback to minor support at 133.92 (low May 19).
In the long term, the constructive stance on the cross remains well supported by the 200-day SMA at 133.16.
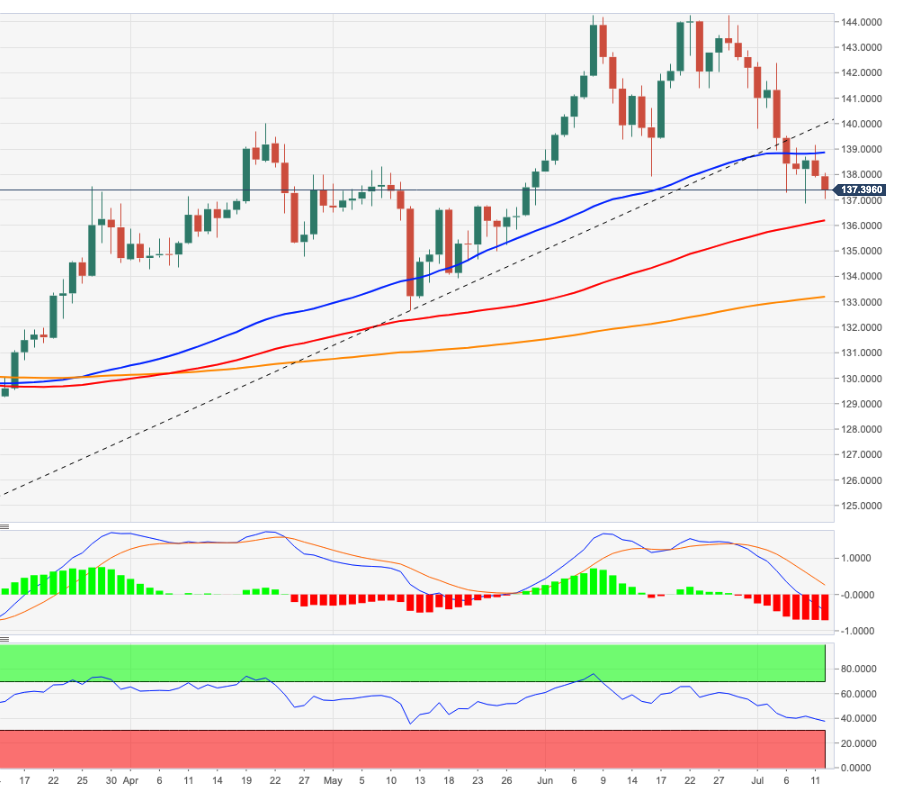
EUR/JPY daily chart
Technical levels
Source: Fx Street
With 6 years of experience, I bring to the table captivating and informative writing in the world news category. My expertise covers a range of industries, including tourism, technology, forex and stocks. From brief social media posts to in-depth articles, I am dedicated to creating compelling content for various platforms.


")

