
- EUR/JPY is trading with modest gains after two consecutive daily declines.
- If the rebound picks up pace, the cross could revisit 138.40.
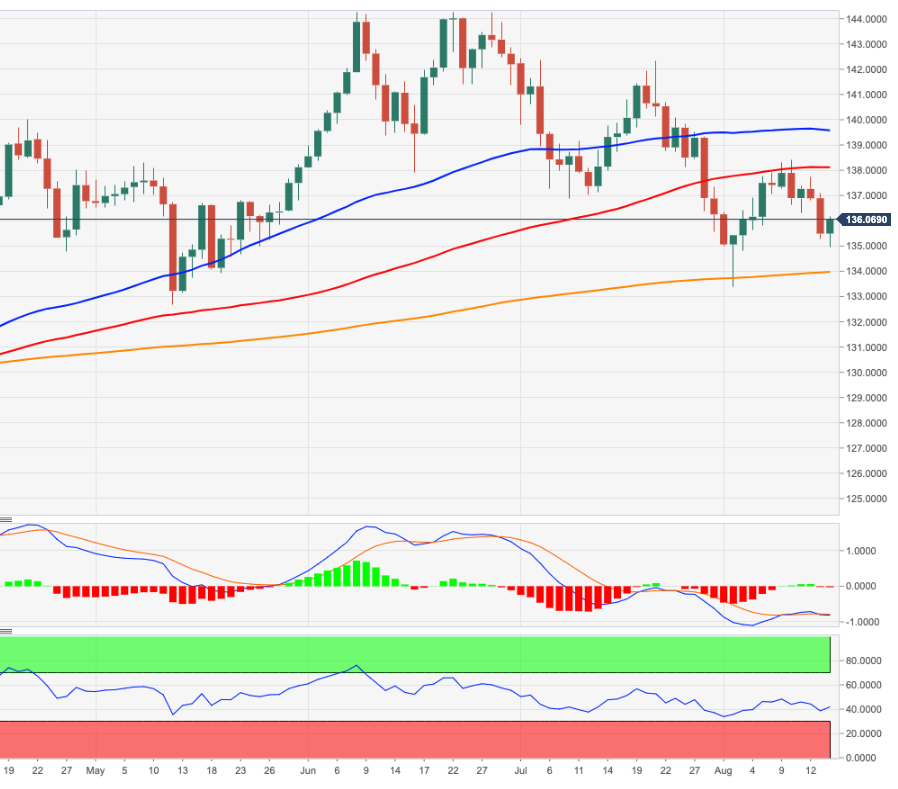
EUR/JPY leaves behind two consecutive daily declines and advances above 136.00 on Tuesday.
Should the recovery become more serious, then the cross should meet the next barrier at the 100-day SMA at 138.08 before the more relevant August high at 138.39 (Aug 10).
As long as it is above the 200 SMA today at 133.94, the outlook for the cross should remain constructive.
EUR/JPY day chart
Source: Fx Street
With 6 years of experience, I bring to the table captivating and informative writing in the world news category. My expertise covers a range of industries, including tourism, technology, forex and stocks. From brief social media posts to in-depth articles, I am dedicated to creating compelling content for various platforms.


