
- EUR/JPY rallies as buyers look for a break above the 100-day EMA at 138.10.
- The risk-off drive was no excuse for euro buyers to drive the shared currency higher.
- If EUR/JPY buyers fail to break above the 138.39 level, the pair would be exposed to selling pressure.
The EUR/JPY rallies towards solid resistance around the 100-day EMA at 138.10 after breaking above the 20-day EMA at 137.29, despite a ri-aversion momentum that usually benefits haven pairs. However, in the currency space, the only safe havens that have risen on the day are the dollar and the Swiss franc. At the time of writing, the EUR/JPY is trading at 137.51, posting gains of 0.72%.
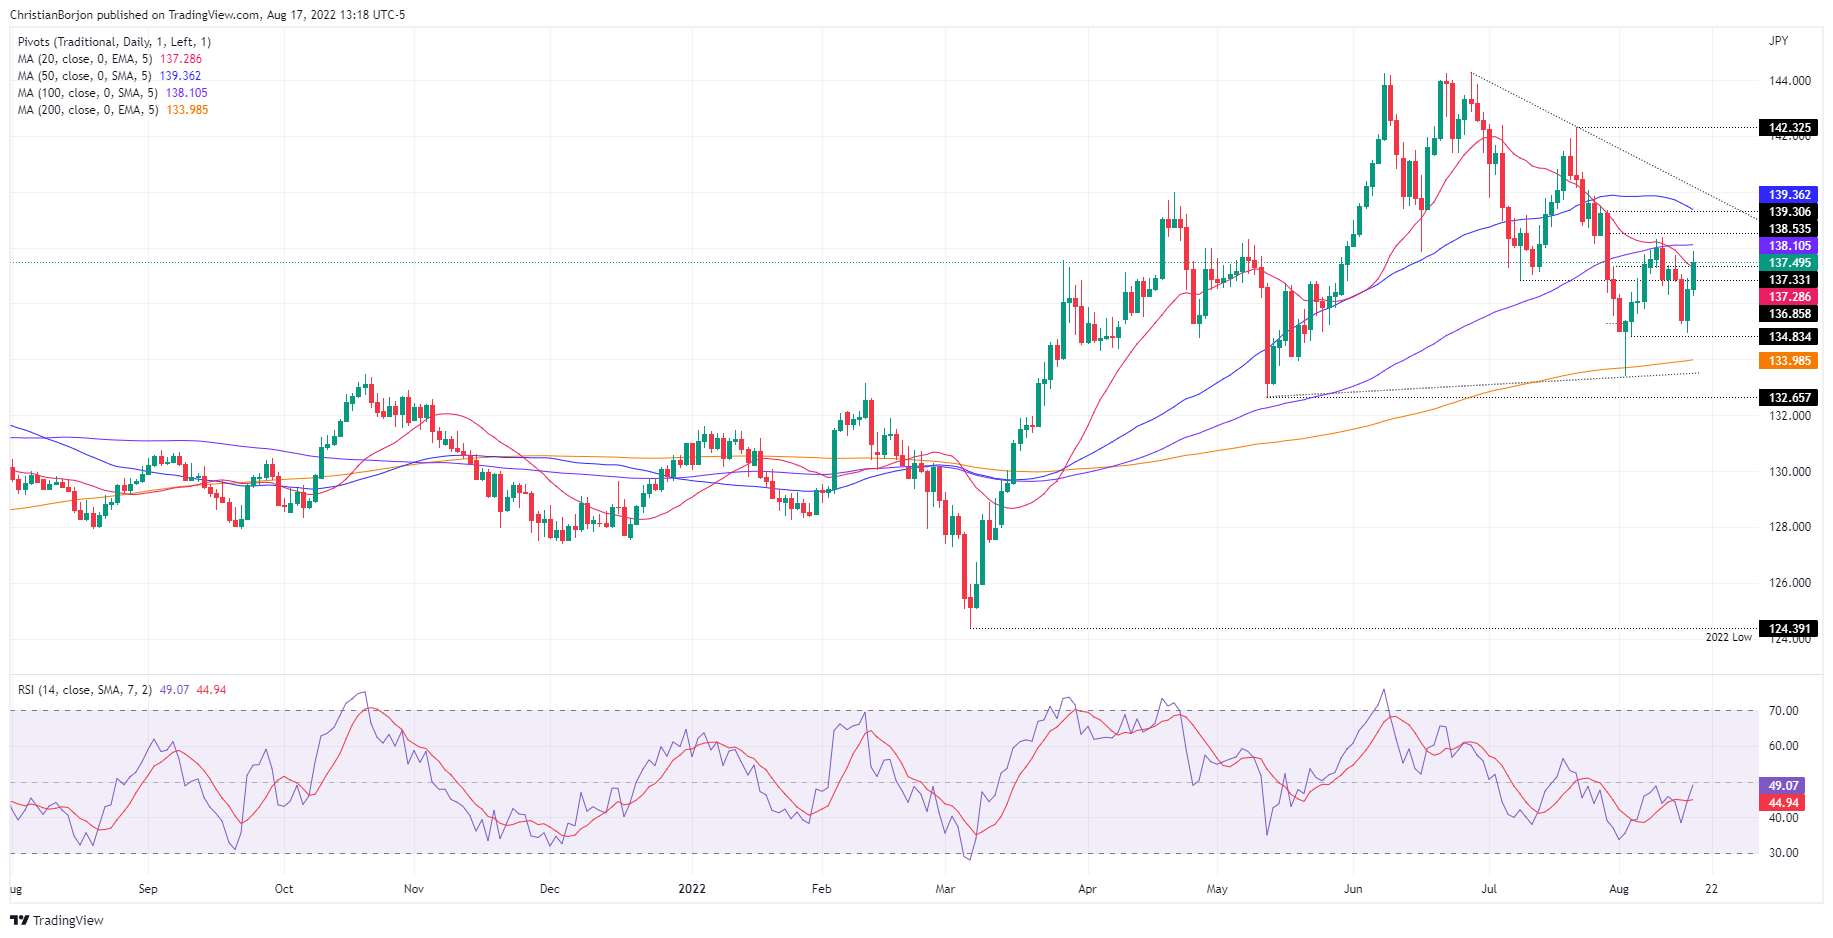
EUR/JPY Price Analysis: Technical Outlook
The daily chart of EUR/JPY shows the pair with a neutral to bullish bias, which is reinforced by the Relative Strength Index (RSI) breaking above the mid-50 line, indicating that buyers are gaining momentum. However, unless it breaks above the 10th Aug daily high at 138.39, there remains a risk of sellers stepping in. If the EUR/JPY recovers this last value, the first resistance would be the figure of 139.00, followed by the 50 day EMA at 139.36 and a descending trend line drawn from the highs of the year around 144.00.
On the other hand, the first support for the EUR/JPY would be the 16th August high, previous resistance turned support, at 136.91. Once broken, the next support will be the 17th Aug low at 136.26, followed by the 16th Aug daily low at 134.94.
Technical levels
Source: Fx Street
With 6 years of experience, I bring to the table captivating and informative writing in the world news category. My expertise covers a range of industries, including tourism, technology, forex and stocks. From brief social media posts to in-depth articles, I am dedicated to creating compelling content for various platforms.


