
- EUR/JPY adds to gains on Monday, past the 139.00 barrier.
- Immediately to the upside is now the 200 day SMA.
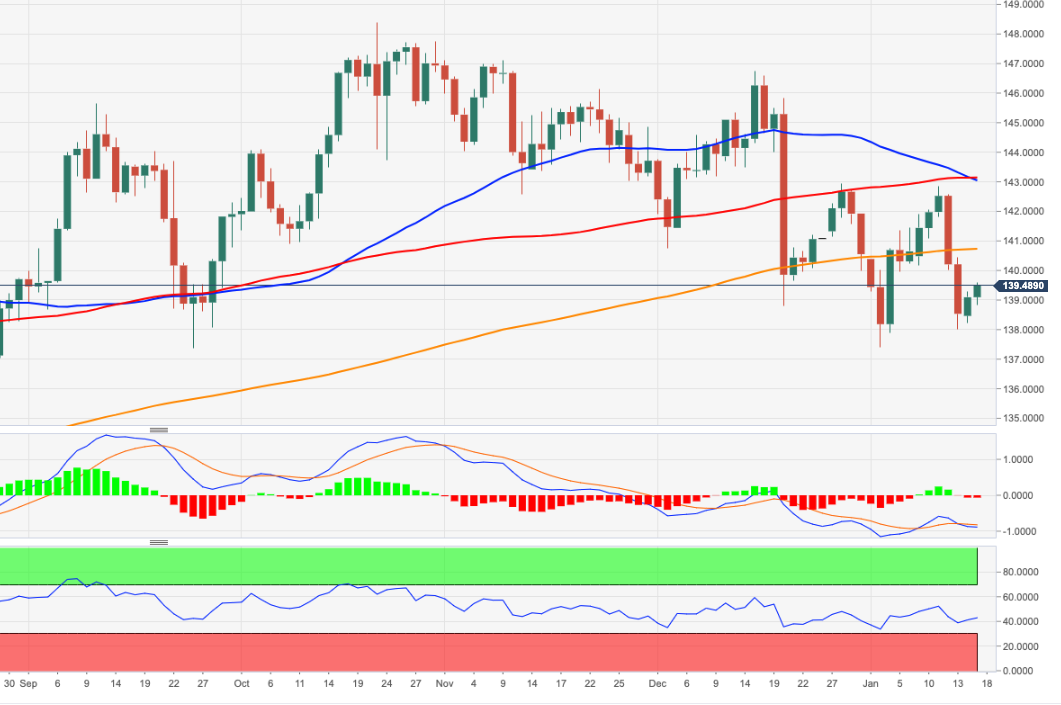
EUR/JPY advances for the second session in a row and extends the break of the 138.00 area on Tuesday.
Last week’s sharp pullback seems to have found quite solid support at the 138.00 area for now. The subsequent bounce looks healthy and initially targets the key 200 day SMA today at 140.70.
The outlook for EUR/JPY should remain negative as long as it holds below the 200-day SMA.
EUR/JPY day chart
Source: Fx Street
I am Joshua Winder, a senior-level journalist and editor at World Stock Market. I specialize in covering news related to the stock market and economic trends. With more than 8 years of experience in this field, I have become an expert in financial reporting.


