
- EUR/JPY advances towards new yearly highs above 161.00.
- There are no major upside barriers to the 2008 high near 170.00.
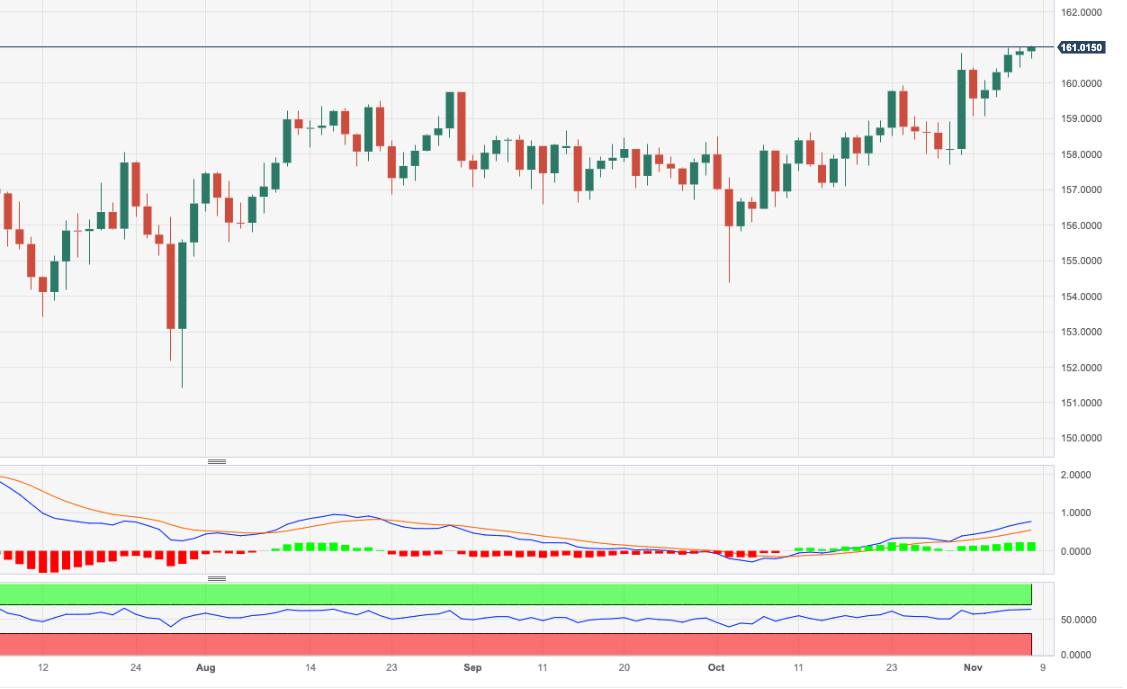
He EUR/JPY extends its northward march for the fifth consecutive session and hits a new 2023 high beyond the 161.00 hurdle on Wednesday.
On the short-term horizon, the cross could continue to rise. Conversely, the breakout of the 2023 high of 161.05 (November 8) is expected to face the next significant resistance level, not before the 2008 high of 169.96 (July 23).
For now, the positive long-term outlook for the cross seems favored as long as it remains above the 200-day SMA, today at 151.92.
EUR/JPY Daily Chart
Source: Fx Street
I am Joshua Winder, a senior-level journalist and editor at World Stock Market. I specialize in covering news related to the stock market and economic trends. With more than 8 years of experience in this field, I have become an expert in financial reporting.


