
- EUR/USD heads south towards 0.9800 as dollar bulls regain composure.
- Treasury yields are holding on to recent gains on the Fed’s dovish outlook.
- Breakout of the one-day ascending triangle suggests further declines for EUR/USD.
The EUR/USD is hovering above the 0.9800 zone on the European pre-open as the US dollar is breaking its consolidation to the upside. The pair has fallen to an intraday low at 0.9818 after previously hitting a daily high at 0.9852.
Investors brace for a series of preliminary releases from the Eurozone and US economies that may offer a fresh boost in trading, while the dust settles on the Fed fallout. Fed Chairman Jerome Powell, scheduled for the US session, will also command attention as it will be his first appearance following Wednesday’s rate hike decision.
Meanwhile, US Treasury yields remain at their recent high, supporting dollar bulls while putting downward pressure on major pairs. Furthermore, the euro also remains vulnerable, following the new Russian threat.
On Wednesday, Russian President Vladimir Putin announced a partial military mobilization in Ukraine, denting market sentiment and reinforcing safe-haven bids for the dollar.
The Russian-Ukrainian crisis and the consequent cutoff of the flow of gas from Moscow to Europe have placed the old continent on the verge of recession. Upcoming Eurozone manufacturing and services PMIs could shed new light on the region’s health.
EUR/USD: Technical Outlook
Looking at the EUR/USD daily chart, the confirmed ascending triangle breakout, following the Fed decision on Wednesday, maintains downside exposure to 0.9750the psychological level. But the bears need a sustained break below the 0.9800 level before this.
The 14-day Relative Strength Index (RSI) remains bearish as it hovers just above the oversold territory, adding credence to the next move lower.
EUR/USD: Daily Chart
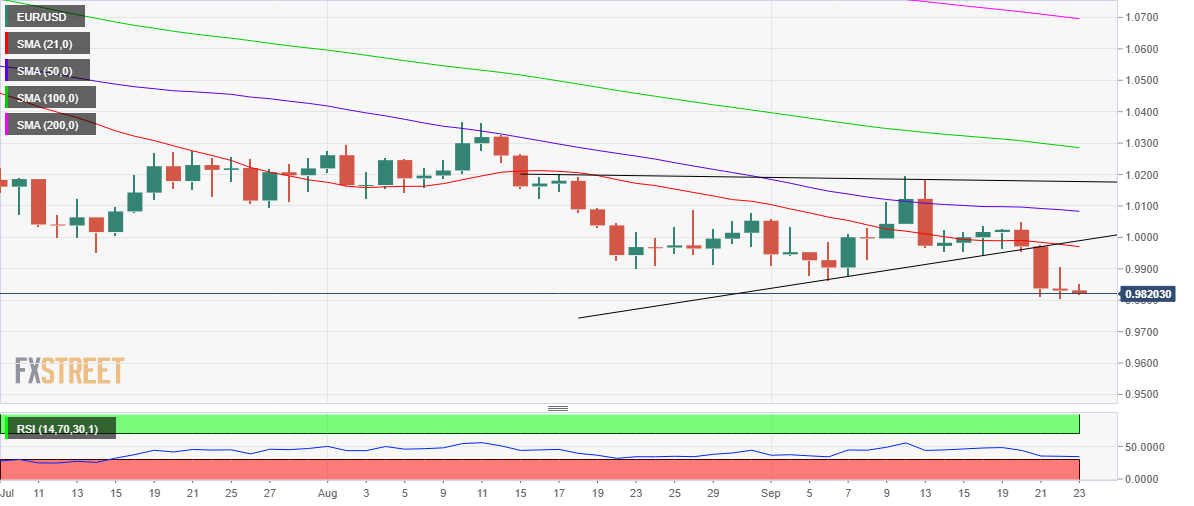
On the other hand, Thursday’s high in 0.9907 will be the first critical resistance in case the pair attempts a recovery.
Further up, the daily close above the confluence of the bearish Daily Moving Average (DMA) and triangle support turned resistance around 0.9970 will test buyers.
EUR/USD: Additional Levels to Consider
Source: Fx Street
With 6 years of experience, I bring to the table captivating and informative writing in the world news category. My expertise covers a range of industries, including tourism, technology, forex and stocks. From brief social media posts to in-depth articles, I am dedicated to creating compelling content for various platforms.


