
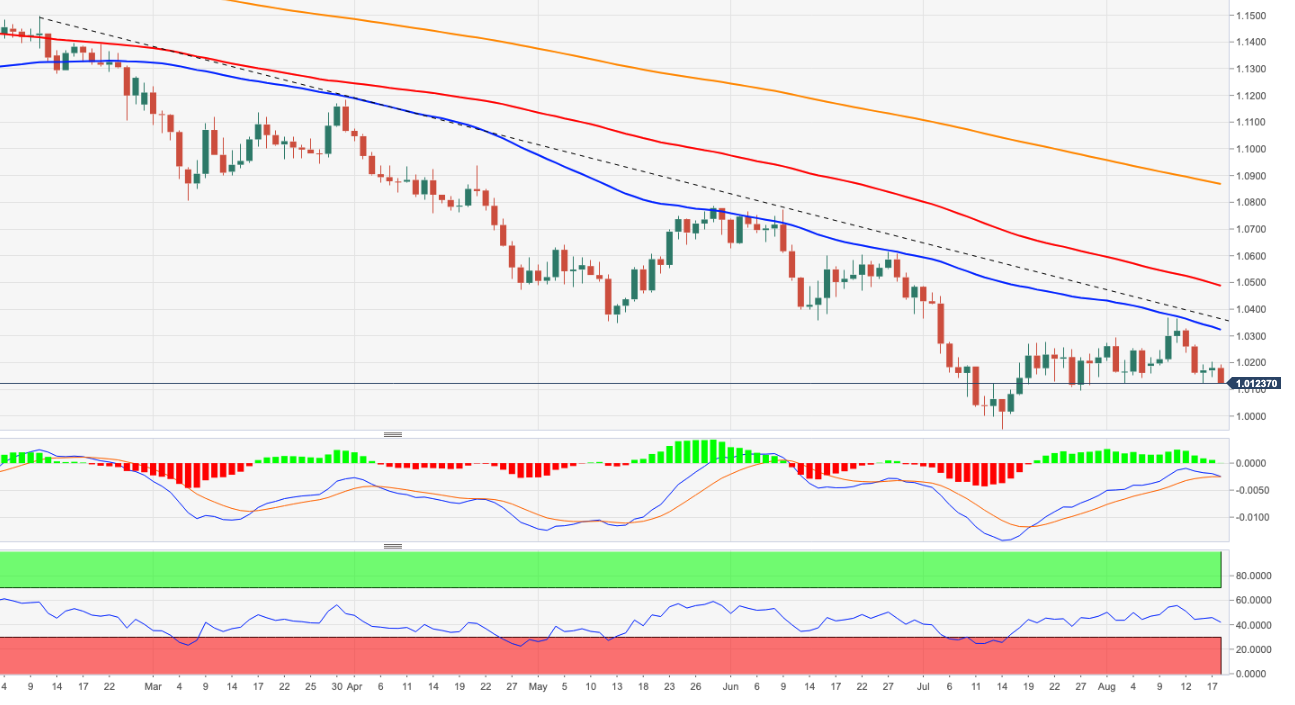
- EUR/USD reverses some of the recent gains and revisits 1.0130.
- An immediate fall would send the pair to the weekly low of 1.0096.
The EUR/USD resumes the downward path and revisits the 1.0130/25 area after two consecutive daily advances.
Further losses should find the next support at the weekly low of 1.0096 (July 27). Should the sellers push further, the pair could face the psychological parity level in the not too distant future.
Longer term, the bearish view on the pair is expected to prevail as long as it trades below the 200-day SMA at 1.0867.
EUR/USD daily chart
Technical levels
Source: Fx Street
With 6 years of experience, I bring to the table captivating and informative writing in the world news category. My expertise covers a range of industries, including tourism, technology, forex and stocks. From brief social media posts to in-depth articles, I am dedicated to creating compelling content for various platforms.


