
- EUR/USD remains under pressure and falls below 0.9900.
- The 2022 low is located at 0.9863 (September 6).
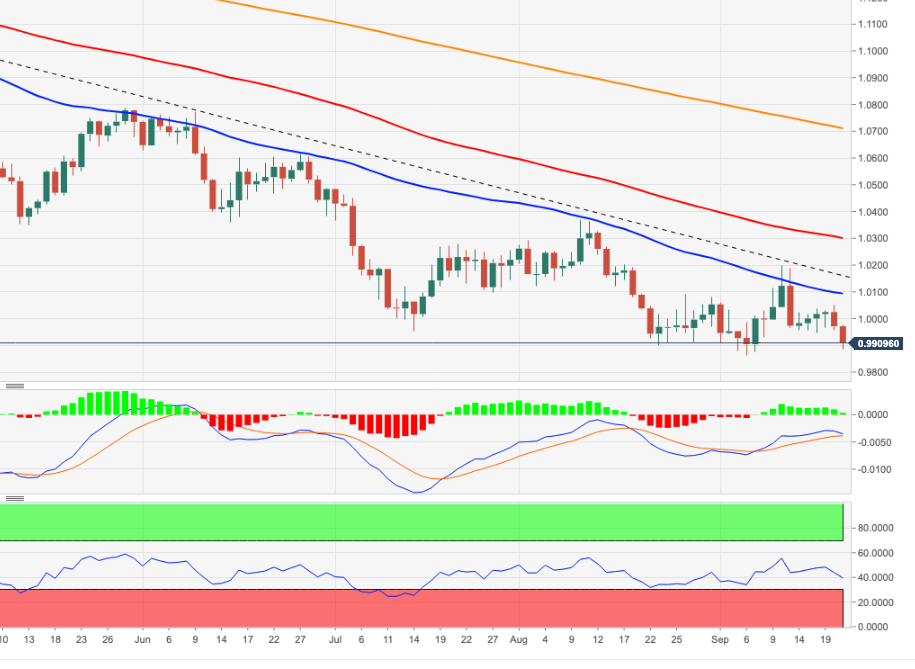
EUR/USD deepens its weekly correction and breaks key support in the 0.9900 area on Wednesday.
The pair has embarked on a corrective decline and this carries the potential to extend further and revisit the 2022 low at 0.9863 (Sep 6). The loss of this area should put the December 2002 low at 0.9859 back on the radar before the October 2022 low at 0.9685.
In the long term, the bearish view on the pair is expected to prevail as long as it trades below the 200 SMA at 1.0709.
EUR/USD day chart
Source: Fx Street
With 6 years of experience, I bring to the table captivating and informative writing in the world news category. My expertise covers a range of industries, including tourism, technology, forex and stocks. From brief social media posts to in-depth articles, I am dedicated to creating compelling content for various platforms.


