
- EUR/USD loses traction and falls to 1.0550 area; remains below the 50 and 100 hour EMAs.
- The oversold condition of the RSI indicates that further consolidation cannot be ruled out.
- The immediate resistance level will be at 1.0600; while 1.0540 acts as a key support level.
The EUR/USD pair remains under selling pressure for the seventh consecutive day during the early hours of the European session on Wednesday. The pair registers its lowest level since March 16 due to the hawkish stance of the Federal Reserve (Fed) and a sign that the European Central Bank (ECB) could avoid further rate hikes. The pair is currently trading around 1.0563, losing 0.09% on the day.
According to the four-hour chart, the EUR/USD pair remains below the downward-sloping 50 and 100 hourly exponential moving averages (EMA), which means that the path of least resistance for the pair is to the downside. The Relative Strength Index (RSI) remains in bearish territory below 50. However, the oversold condition indicates that further consolidation cannot be ruled out before positioning for any short-term EUR/USD depreciation.
That being said, the immediate resistance level for EUR/USD will emerge near the 1.0600 round level. The additional bullish filter is placed at 1.0640 (50-hour EMA). The critical barrier to watch is the 1.0675-1.0685 region, which represents the confluence of the upper boundary of the Bollinger Bands and the 100 hourly EMA.
On the downside, the lower boundary of the Bollinger Bands at 1.0540 acts as a key support level for EUR/USD. Further down, the pair’s next support lies at 1.0515 (March 15 low). If there were to continue selling below this last level, the next support would be at 1.0460 (December 6, 2022 low).
EUR/USD 4-hour chart
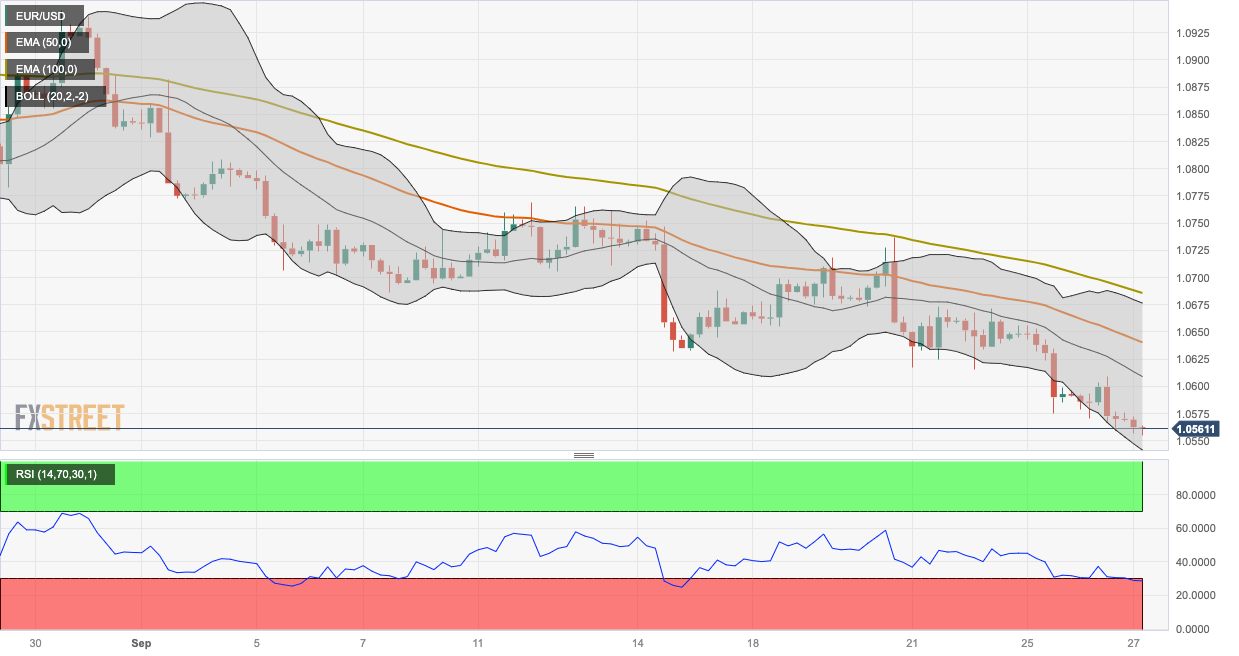
Source: Fx Street
I am Joshua Winder, a senior-level journalist and editor at World Stock Market. I specialize in covering news related to the stock market and economic trends. With more than 8 years of experience in this field, I have become an expert in financial reporting.


