
- USD/JPY finds bullish support due to US economic data.
- Momentum indicators suggest a prevailing bullish sentiment in the markets.
- The psychological level of 148.00 could emerge as a key support aligned with the 14-day EMA.
USD/JPY remains slightly below the highest level reached since last November, trading around the psychological level of 149.10 at the start of the European session on Wednesday. Market caution is boosting US Treasury yields, supporting the US Dollar (USD) against the Japanese Yen (JPY).
Minutes from the Bank of Japan’s monetary policy meeting showed policymakers favored maintaining current monetary easing to meet the price target, while several members stressed downside risks to Japan’s economy. .
The momentum is potentially bullish as the 14-day Relative Strength Index (RSI) continues above the 50 level. The psychological level of 150.00 could act as resistance.
A break above that level could inspire USD/JPY bulls to explore the area around last year’s October high at the 151.94 level.
On the downside, the USD/JPY pair could find key support around the psychological level of 148.00 aligned with the 14-day EMA at 148.01.
If the USD/JPY pair collapses below this latest level, the bears could target the region around the psychological level at 147.00, followed by the 23.6% Fibonacci retracement at 146.36.
The MACD line remains above the center line and the signal line. This setup indicates that the momentum in the USD/JPY price is potentially strong, suggesting bullish sentiment.
USD/JPY daily chart
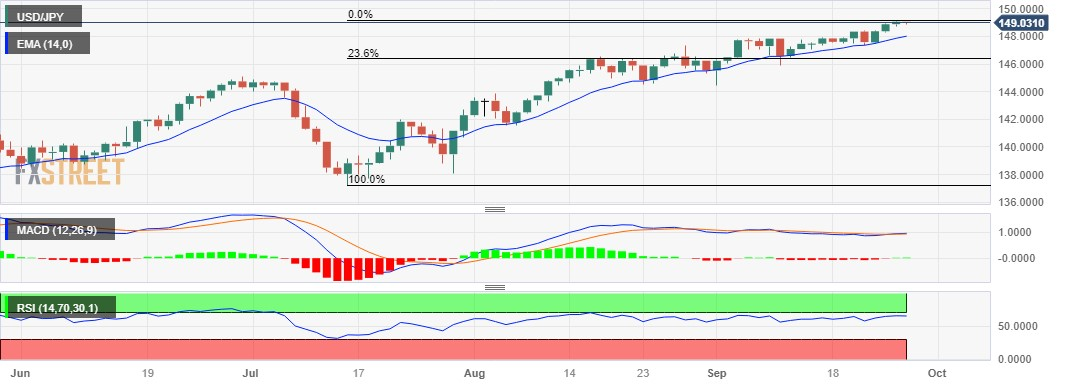
Source: Fx Street
I am Joshua Winder, a senior-level journalist and editor at World Stock Market. I specialize in covering news related to the stock market and economic trends. With more than 8 years of experience in this field, I have become an expert in financial reporting.


 meeting for peace: “First step towards reconciliation”")


