
- EUR/USD intensifies its slide to new four-month lows.
- Bears are turning their attention back to the 1.0630 area.
On Thursday, the EUR/USD it sinks to levels of four months ago, around 1.0600.
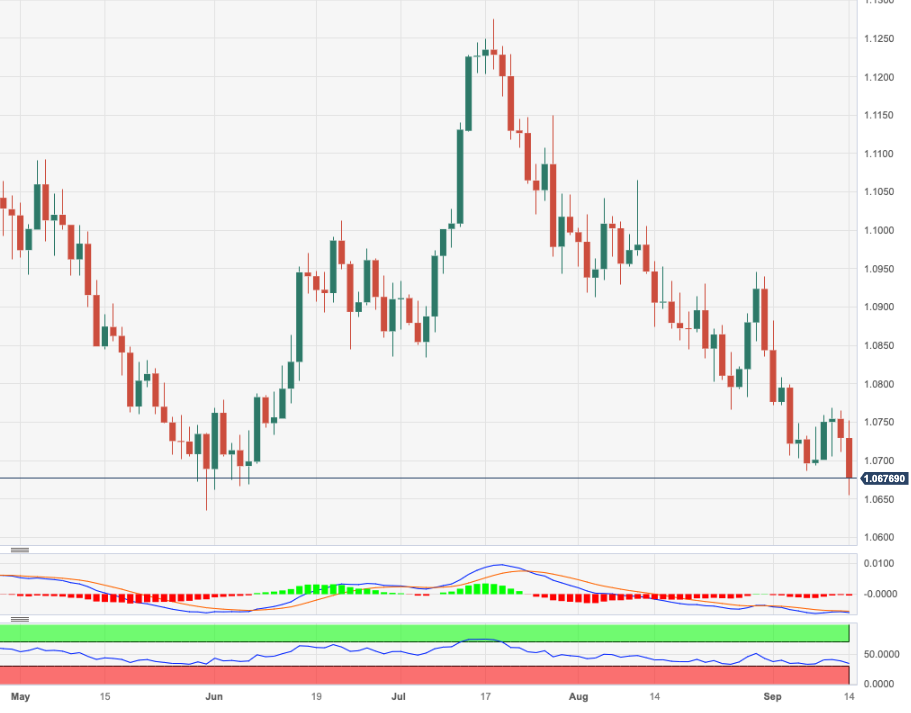
The underlying bearish sentiment remains unchanged and leaves the door open for additional pullbacks on the near-term horizon. Against this backdrop, a sustained break of the 1.0700 level could encourage sellers to embark on a likely visit to the May low at 1.0635 (May 31).
Meanwhile, further losses are expected below the 200-day SMA, today at 1.0827.
EUR/USD Daily Chart
Source: Fx Street
I am Joshua Winder, a senior-level journalist and editor at World Stock Market. I specialize in covering news related to the stock market and economic trends. With more than 8 years of experience in this field, I have become an expert in financial reporting.


