
- EUR/USD continues the downtrend started on Thursday.
- A deeper pullback could see the weekly low of 1.0443 revisited.
The EUR/USD accelerates its losses and falls to multi-week lows south of the key 1.0500 barrier on Friday.
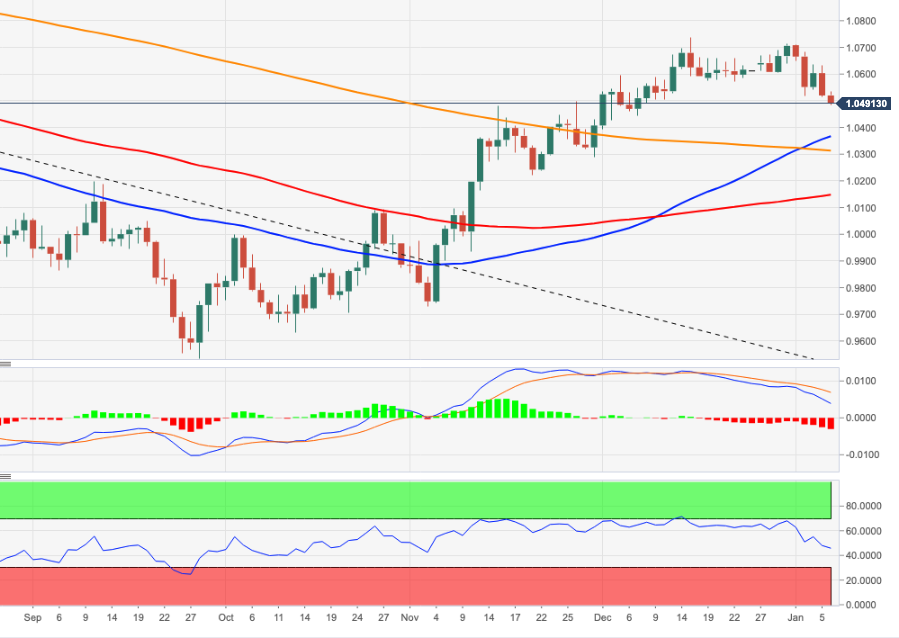
If sellers push harder, the pair could extend the pullback to an initial weekly low of 1.0443 (Dec 7) before the 55-day SMA at 1.0365.
Meanwhile, the pair will continue to rise as long as it stays above the 200-day SMA at 1.0311.
EUR/USD daily chart
Source: Fx Street
I am Joshua Winder, a senior-level journalist and editor at World Stock Market. I specialize in covering news related to the stock market and economic trends. With more than 8 years of experience in this field, I have become an expert in financial reporting.


