
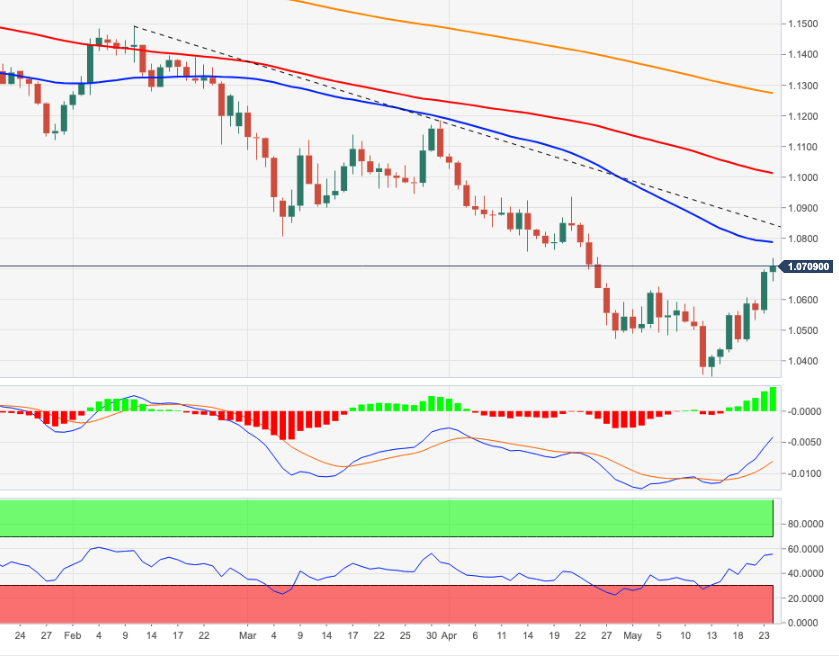
- EUR/USD breaks through the 1.0700 barrier and hits 4-week highs.
- The next target on the upside is at the 55-day SMA.
The EUR/USD see the rally above the 1.0700 barrier accelerate on Tuesday’s trend reversal.
Considering the pair’s ongoing price action, a continuation of the rally seems likely in the very short term at least. That said, the next upside barrier now appears at the 55-day SMA today at 1.0785, ahead of the 3-month resistance line around 1.0840.
Breaking above this area should mitigate selling pressure and allow a likely move towards the weekly high at 1.0936 (21st Apr).
The daily RSI around 55 also indicates that the pair could continue to rise until it reaches the overbought territory (>70).
EUR/USD daily chart
Technical levels
Source: Fx Street
With 6 years of experience, I bring to the table captivating and informative writing in the world news category. My expertise covers a range of industries, including tourism, technology, forex and stocks. From brief social media posts to in-depth articles, I am dedicated to creating compelling content for various platforms.


