
- EUR/USD rises to 4-week highs just below the 1.0200 mark.
- Once that level is surpassed, it seems that there will be more rises.
The EUR/USD adds to Friday’s advance and tests new highs near 1.0200 at the start of the week, an area that coincides with the 7-month resistance line.
The pair now needs to break out of that resistance zone to see its downside pressure eased while allowing a visit to the intermediate 100-Day SMA at 1.0338 before the more relevant August high at 1.0368 (Aug 10).
In the long term, the bearish view of the pair is expected to prevail as long as it trades below the 200-day SMA at 1.0755.
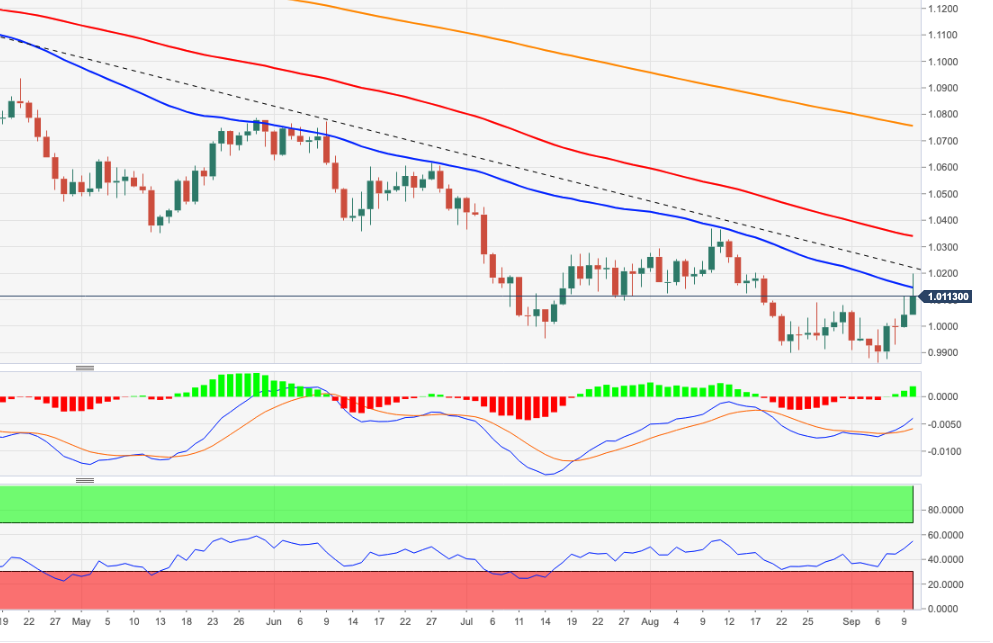
EUR/USD daily chart
Technical levels
Source: Fx Street
With 6 years of experience, I bring to the table captivating and informative writing in the world news category. My expertise covers a range of industries, including tourism, technology, forex and stocks. From brief social media posts to in-depth articles, I am dedicated to creating compelling content for various platforms.


