
- EUR/USD is under modest pressure below parity.
- Solid containment remains around the 0.9900 area.
The EUR/USD loses some ground after Tuesday’s two-day highs in the 1.0050/55 band.
Further consolidation seems the most likely scenario in EUR/USD at the moment, still within the 1.0100-0.9900 range. The pair is expected to keep this theme unchanged for the next two sessions, or at least until the key US Non-Farm Payrolls release (Friday).
Break of the weekly high at 1.0090 (Aug 26) could trigger further gains to 1.0202 (Aug 17 high) before hitting the 55-day SMA today at 1.0222. On the other hand, the loss of the yearly low at 0.9899 (Aug 23) could bring the December 2002 low at 0.9859 back into the spotlight.
In the long term, the bearish view on the pair is expected to prevail as long as it trades below the 200-day SMA at 1.0807.
EUR/USD daily chart
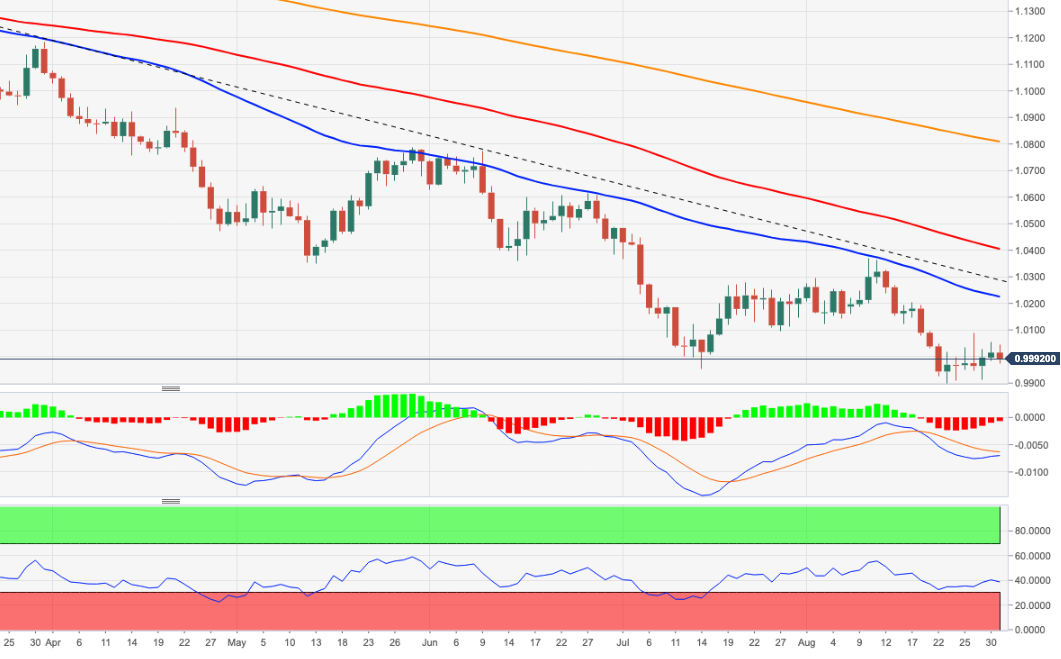
Source: Fx Street
With 6 years of experience, I bring to the table captivating and informative writing in the world news category. My expertise covers a range of industries, including tourism, technology, forex and stocks. From brief social media posts to in-depth articles, I am dedicated to creating compelling content for various platforms.


