
- EUR/USD falls to fresh lows in the area below 1.0400.
- The door is now open for a visit to the 2017 low at 1.0340.
The EUR/USD saw its decline notably accelerate on Thursday, breaking below the 1.0400 support for the first time since early January 2017.
The extra pullbacks stay well on the cards for now. That said, the bets are now up for a test of the 2017 low at 1.0340 sooner rather than later. This area is reinforced by the 2003 low at 1.0334 (Jan 2).
Below the 3-month line near 1.0910, the pair is expected to remain under pressure and vulnerable to further losses.
EUR/USD daily chart
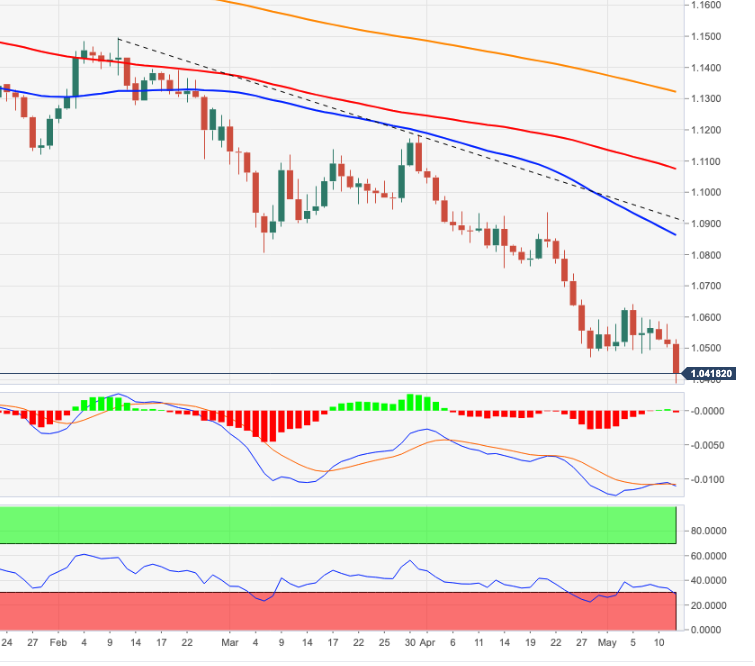
Technical levels
Source: Fx Street
With 6 years of experience, I bring to the table captivating and informative writing in the world news category. My expertise covers a range of industries, including tourism, technology, forex and stocks. From brief social media posts to in-depth articles, I am dedicated to creating compelling content for various platforms.


