
- EURUSD runs into bearish pressure near 1.0100 on Wednesday.
- Exceeding this area could allow more rises in the short term.
The strong EURUSD recovery appears to have hit a tough snag at the 1.0100 area so far this week.
If the pair manages to break above this zone sustainably, it could challenge the September high of 1.0197 (Sep 12) ahead of the August high of 1.0368 (Aug 10).
As long as it is above the 9-month resistance line, today near 0.9840, further gains seem likely.
In the long term, the bearish view on the pair should remain unchanged as long as it is below the 200 SMA at 1.0450.
EURUSD day chart
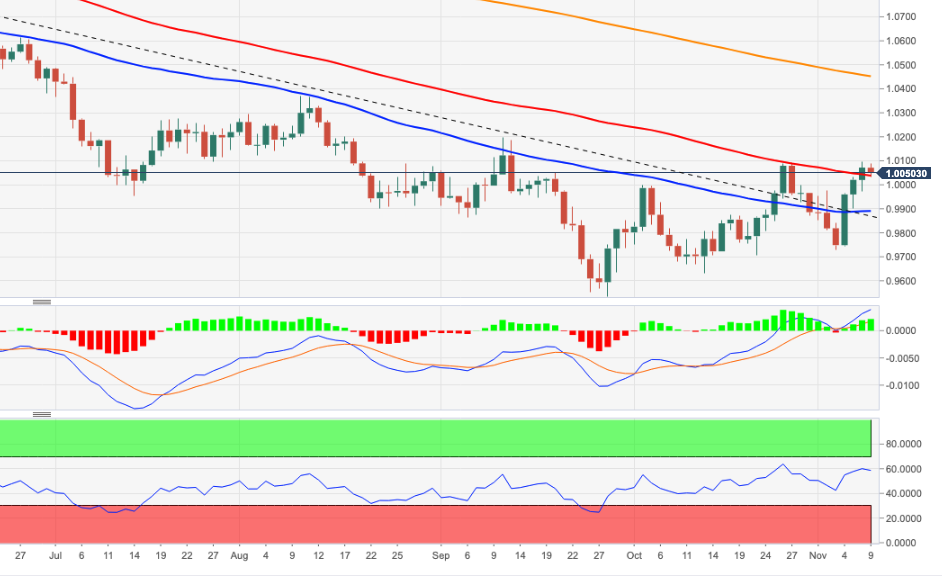
Source: Fx Street
With 6 years of experience, I bring to the table captivating and informative writing in the world news category. My expertise covers a range of industries, including tourism, technology, forex and stocks. From brief social media posts to in-depth articles, I am dedicated to creating compelling content for various platforms.


