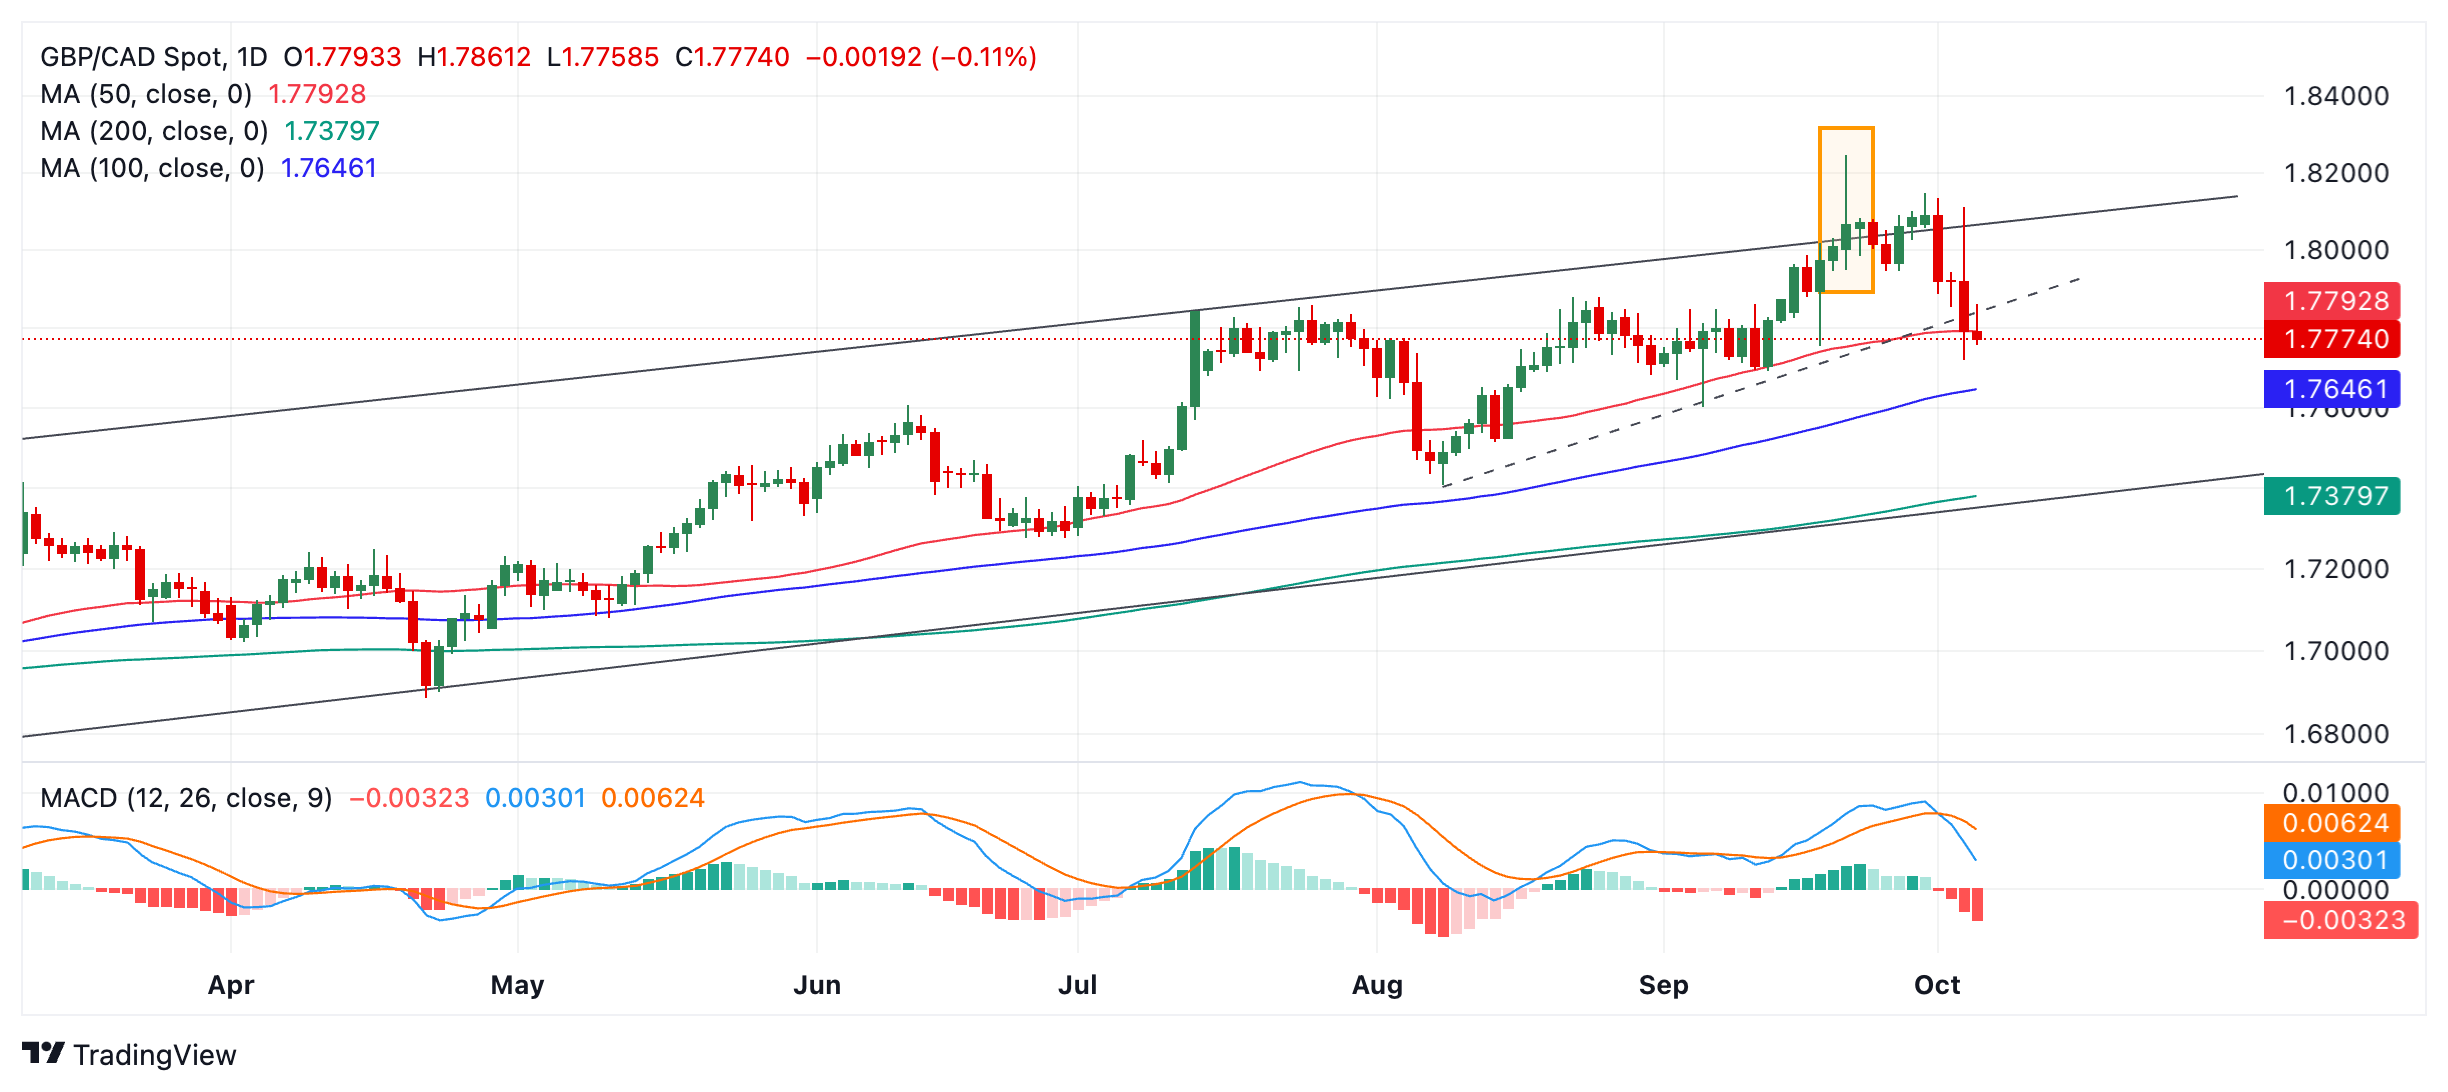
- GBP/CAD has fallen sharply within an ascending channel.
- The pair will likely continue lower as the countertrend reaction takes its course.
GBP/CAD is developing a bearish leg within an ascending channel. It will likely continue lower at least to the blue 100-day SMA at 1.7641. A break below the October 3 low at 1.7720 would solidify bearish bets.
The pair is in a short-term downtrend and given the principle that “the trend is your friend”, the odds favor a continuation of that trend.
GBP/CAD Daily Chart
The next downside targets are at 1.7603 (September 4 low) and 1.7407 (August 8 low). In the most bearish scenario, the price could fall to the lower channel line at 1.7375.
That said, short position holders are advised to exercise caution as GBP/CAD is in an uptrend on the medium and long-term time frames as it oscillates higher within an ascending channel. Therefore, there is a risk of an upside reversal unless the current sell-off ushers in a deeper downtrend. This is possible given its steep drop.
The Moving Average Convergence/Divergence (MACD) indicator has sharply crossed below its signal line, providing additional bearish confirmation.
The formation of a bearish Shooting Star-type candlestick reversal pattern on September 20 (orange rectangle on the chart above) gave the first signs of weakness. It then consolidated for a while before starting to fall properly on October 1st.
Source: Fx Street
I am Joshua Winder, a senior-level journalist and editor at World Stock Market. I specialize in covering news related to the stock market and economic trends. With more than 8 years of experience in this field, I have become an expert in financial reporting.


