
- GBP/JPY rallies 200 pips and hits a daily high of 165.08.
- Sterling was buoyed by market sentiment, despite US data reigniting recession fears.
- GBP/JPY remains range bound after hitting a double bottom target at 164.50.
The GBP/JPY erases last Friday’s losses and gains close to 1% on Monday, amid a better market mood, with US stocks rising, before US tech mega-corporations report results, after US data further reinforce the recession scenario. At the time of writing, the GBP/JPY pair is trading at 164.70.
GBP/JPY Price Analysis: Technical Outlook
From a daily chart point of view, the GBP/JPY pair remains in a bullish bias as sellers are unable to sustain prices below the 50-day EMA at 163.62. It is also worth noting that the Relative Strength Index (RSI) came out of negative territory, and is about to break above the RSI’s 7-day SMA around 52.41, which would exacerbate and open a move to the top. from July 21 at 165.98. However, GBP/JPY would be vulnerable to selling pressure unless the latter is achieved.
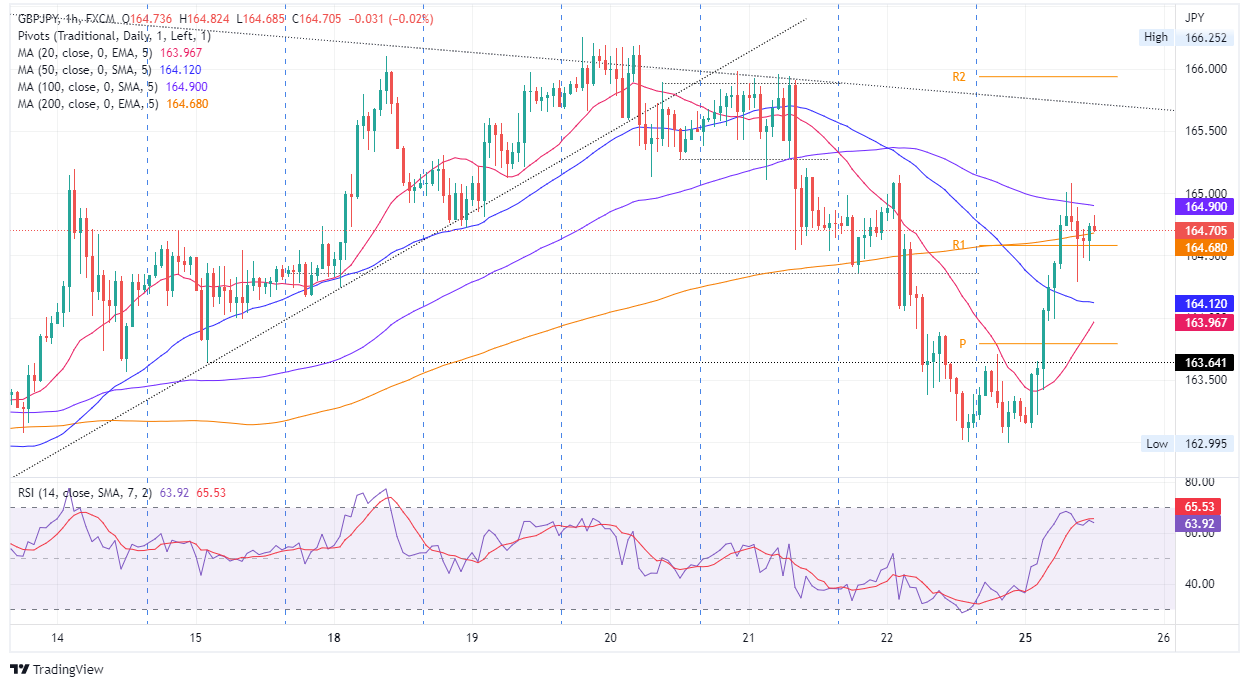
GBP/JPY 1 hour chart
The GBP/JPY 1 hour chart shows that the pair formed a double bottom around the 163.00 area, which reinforced the cross, which rallied close to 200 pips. On its way north, the GBP/JPY pierced the 100 hourly EMA at 164.90 before pulling back above the 200 hourly EMA at 164.68. However, as the RSI is about to enter overbought conditions and price action lacks the strength to break 165.00 at the end of the American session, I would keep the pair in a range.
GBP/JPY’s first resistance would be the July 25 high at 165.08. A break above will expose the confluence of the 21st Jul high and the R2 pivot around 166.00. On the other hand, the first GBP/JPY support would be the R1 daily pivot point at 164.58. Once broken, the next support would be the 163.97-164.12 zone, followed by the daily pivot point at 163.79.
Technical levels
Source: Fx Street
With 6 years of experience, I bring to the table captivating and informative writing in the world news category. My expertise covers a range of industries, including tourism, technology, forex and stocks. From brief social media posts to in-depth articles, I am dedicated to creating compelling content for various platforms.


 music")

