
- GBP/JPY plunged at the confluence of two resistance levels, around 161.00.
- GBP/JPY remains biased to the downside and could test 155.00 once it breaks the yearly low of 155.35.
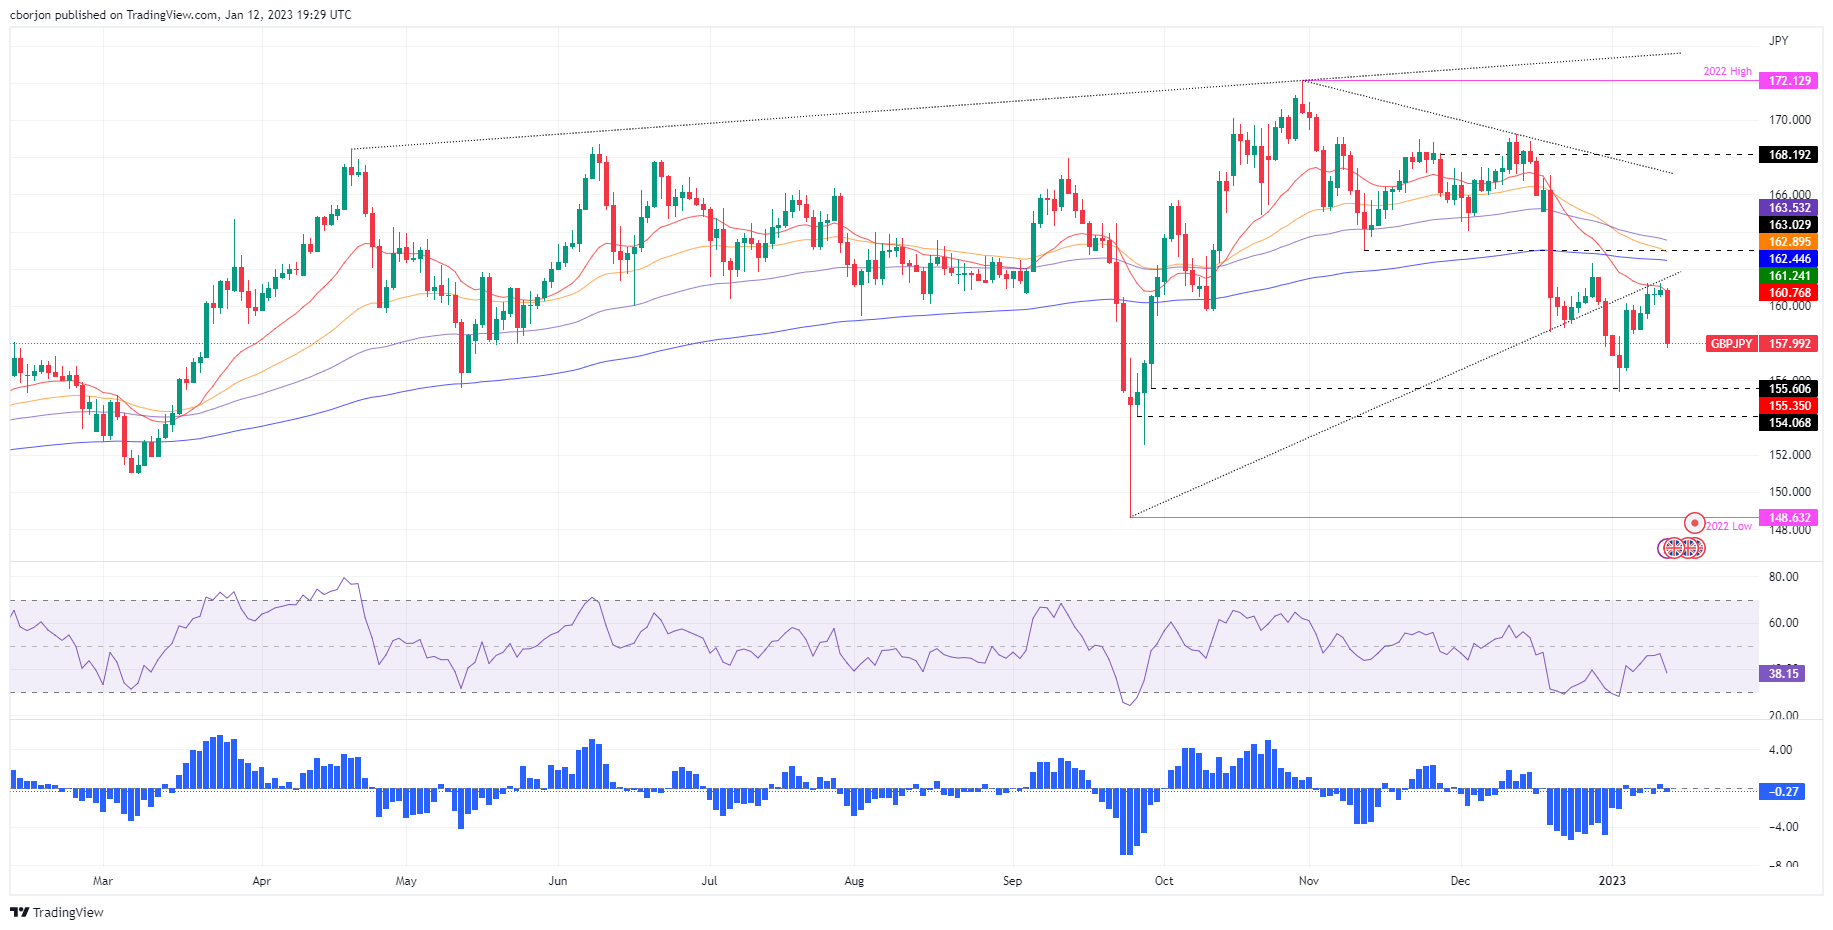
GBP/JPY fell to fresh weekly lows of 157.72 after a colder-than-expected US inflation report spurred safe-haven flows into the currency space amid upbeat sentiment in the markets. From a technical point of view, the GBP/JPY pair stalled around the 20-day EMA at 160.75 and fell around 300 pips. The GBP/JPY pair is trading around 158.00
GBP/JPY Price Analysis: Technical Perspective
From a daily chart perspective, the GBP/JPY pair remains skewed to the downside. After posting four straight days of profitable trading, a fundamental news catalyst and solid resistance at the 20-day EMA around 160.75 triggered a decline. Oscillators such as the Relative Strength Index (RSI) in bearish territory with continuation lower support a possible test of the lows of 155.36. Furthermore, the CRT shows that volatility has yet to pick up, which could deter traders from opening further bearish positions in GBP/JPY.
However, if the GBP/JPY were to continue falling, its next support would be 157.00. A break of this latter level would uncover the January 4 daily low at 156.49, followed by the yearly low at 155.35 and finally the September 22 low at 152.54.
On the other hand, the first resistance for GBP/JPY would be the January 4 daily high at 160.16, followed by the 20-day EMA at 160.76, and then the current week’s high at 161.21.
GBP/JPY technical levels
Source: Fx Street
I am Joshua Winder, a senior-level journalist and editor at World Stock Market. I specialize in covering news related to the stock market and economic trends. With more than 8 years of experience in this field, I have become an expert in financial reporting.


