
- GBP/JPY rises more than 0.20%, showing resilience ahead of key UK economic releases.
- Technical indicators suggest bullish momentum, with the pair sailing inside the Ichimoku Cloud.
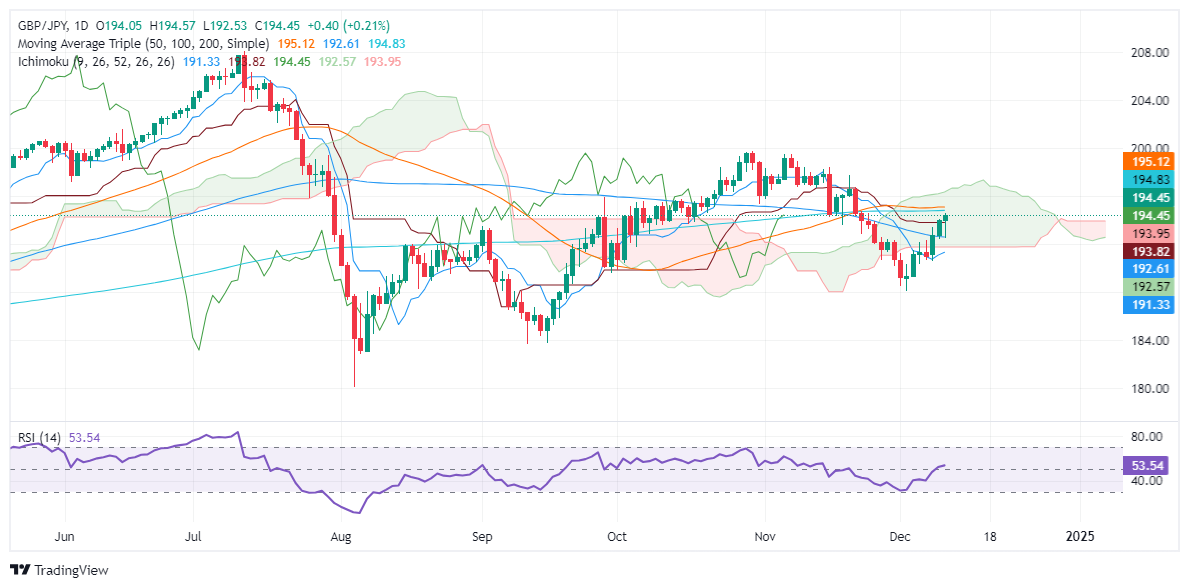
- Key resistance at 200-day SMA of 194.74; Support levels to watch include 193.95 and the 100-day SMA at 192.53.
The British Pound posted decent gains of over 0.20% against the Japanese Yen in early trading of the North American session on Wednesday despite the lack of a catalyst to drive the former. GBP/JPY is trading at 194.46 after bouncing from daily lows of 192.49.
Price action remains slightly muted. Traders are awaiting the release of UK Gross Domestic Product (GDP) figures on Friday, which are expected to show an improvement on October figures.
GBP/JPY Price Forecast: Technical Outlook
GBP/JPY recovered after falling more than 4.58% in mid-November, reaching its lowest level since September at 188.06. However, buyers pushed the exchange rate well into the Ichimoku (Kumo) Cloud, surpassing key technical resistance levels such as the Tenkan-Sen and Kijun-Sen.
Momentum increased, showing that the bulls are in charge, as shown by the Relative Strength Index (RSI), which turned bullish, with the slope pointing upwards.
If GBP/JPY surpasses the 200-day Simple Moving Average (SMA) at 194.74, further upside is expected. The next 50-day SMA is at 195.06. A break of the latter exposes the Kumo top at 196.20-40.
Conversely, if GBP/JPY falls below the confluence of the Kijun-Sen and Senkou Span B around 193.95, the next support would be the 100-day SMA at 192.53 before testing the bottom of the Kumo at 191.75-95.
GBP/JPY Price Chart – Daily
Pound Sterling PRICE Today
The table below shows the percentage change of the British Pound (GBP) against major currencies today. Pound sterling was the strongest currency against the Japanese Yen.
| USD | EUR | GBP | JPY | CAD | AUD | NZD | CHF | |
|---|---|---|---|---|---|---|---|---|
| USD | 0.12% | 0.22% | 0.43% | -0.00% | 0.27% | 0.28% | 0.00% | |
| EUR | -0.12% | 0.09% | 0.32% | -0.12% | 0.15% | 0.16% | -0.11% | |
| GBP | -0.22% | -0.09% | 0.19% | -0.22% | 0.06% | 0.06% | -0.21% | |
| JPY | -0.43% | -0.32% | -0.19% | -0.44% | -0.16% | -0.17% | -0.42% | |
| CAD | 0.00% | 0.12% | 0.22% | 0.44% | 0.27% | 0.28% | 0.01% | |
| AUD | -0.27% | -0.15% | -0.06% | 0.16% | -0.27% | 0.00% | -0.26% | |
| NZD | -0.28% | -0.16% | -0.06% | 0.17% | -0.28% | -0.01% | -0.27% | |
| CHF | -0.01% | 0.11% | 0.21% | 0.42% | -0.01% | 0.26% | 0.27% |
The heat map shows percentage changes for major currencies. The base currency is selected from the left column, while the quote currency is selected from the top row. For example, if you choose the British Pound from the left column and move along the horizontal line to the US Dollar, the percentage change shown in the box will represent the GBP (base)/USD (quote).
Source: Fx Street
I am Joshua Winder, a senior-level journalist and editor at World Stock Market. I specialize in covering news related to the stock market and economic trends. With more than 8 years of experience in this field, I have become an expert in financial reporting.


