- GBP/USD rises amid weak US data and a possible pause in Fed policy.
- Despite the seven-month drop in the ISM PMI, Wall Street remains positive.
- The UK is facing a sharp drop in house prices; high inflation triggers BoE adjustment speculation.
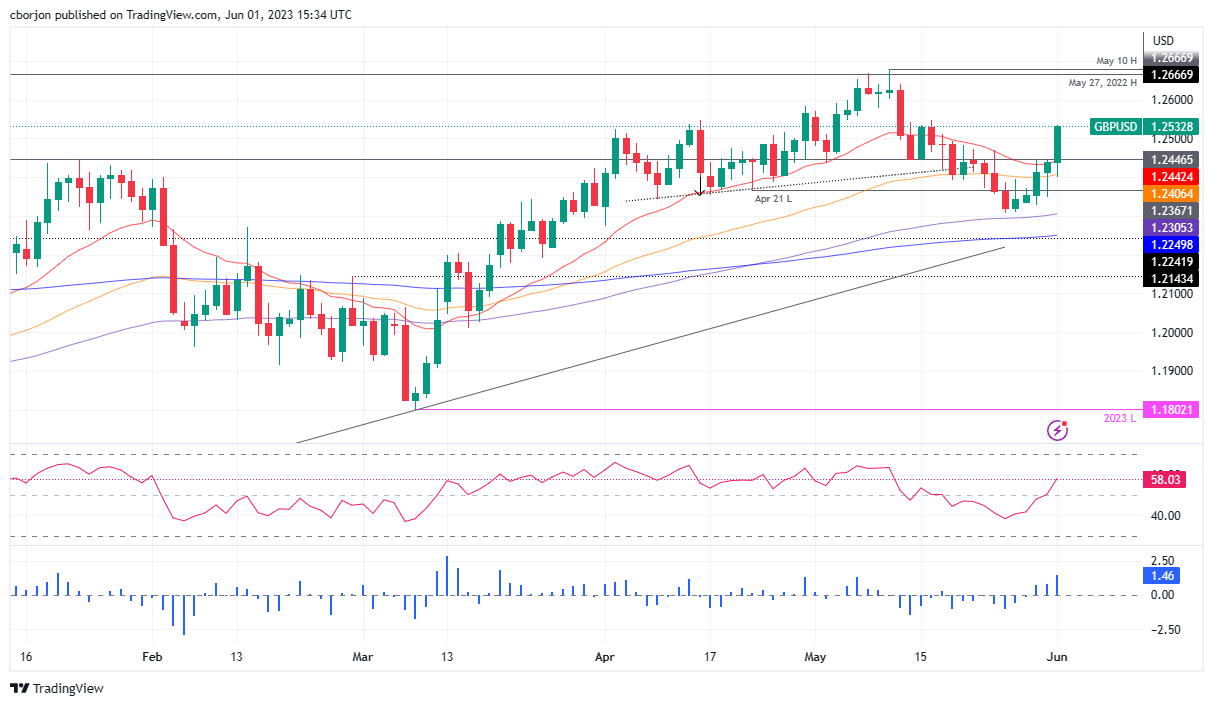
GBP/USD rises in the North American session driven by weak economic data from the United States, with a slowdown in business activity. In addition, US Federal Reserve (Fed) officials, who advocate a “jump” in its tightening cycle, cut the odds of a rate hike at the upcoming meeting in June. GBP/USD is trading around 1.2515 after hitting a low of 1.2400.
GBP/USD rises, the Fed considers a pause in the tightening cycle and Wall Street reacts to the seven-month fall in the ISM manufacturing PMI
Wall Street reacted positively to data from the Institute for Supply Management (ISM), which revealed that manufacturing activity fell for the seventh consecutive month. The ISM manufacturing PMI came in at 46.9, below April’s 47.1 and estimates of 47, as readings below 50 are considered recessive. Factors such as the Fed’s aggressive 500 basis point (bp) tightening weighed on the index as new orders tumbled.
The ISM data weighed on the US dollar (USD), as evidenced by the fact that GBP/USD surged from around 1.2470, breaking above 1.2500 again, following the release of two more US jobs reports, which triggered a bounce from 1.2440 towards the top.
When it comes to employment, the ADP National Employment Report showed private hiring rose by 278,000 in May, beating estimates of 170,000 but down from April’s astonishing 291,000. Although it showed signs that the labor market remains tight, this was confirmed by US jobless claims.
Initial jobless claims for the week ending May 27 rose by 232,000, disappointing the expected 235,000, but up from 230,000 the week before, a figure revised lower.
Given the latest round of data, Philadelphia Fed President Patrick Harker is expected to make some remarks later in the day. However, GBP/USD traders should keep in mind the latest remarks by Fed Governor Philip Jefferson, in which he pointed to a rate hike at the June meeting, comments Harker seconded. However, Harker added that the incoming data could “change your mind.”
On the other hand, the British calendar revealed that house prices registered the biggest drop since 2009, blamed on the rise in interest rates by the Bank of England (BoE). The latest inflation report shows signs of easing, but it is still four times above the BoE’s target. Following the release of the Consumer Price Index (CPI), investors forecast further tightening from the BoE.
GBP/USD Price Analysis: Technical Perspective

GBP/USD resumed its bullish trajectory after spending two days stuck to the bottom of the 20-day EMA at 1.2441. Fundamental news supported the Pound’s appreciation, and since reclaiming the 1.2500 figure, the path of least resistance is north. The next resistance levels lie at the May 16 high at 1.2546 and the 1.2600 figure. Technical indicators such as the Relative Strength Index (RSI) and the 3-Day Exchange Rate (RoC) show that the bulls are gaining momentum, so any pullback could serve to resume the overall uptrend.
GBP/USD
| Overview | |
|---|---|
| Last price today | 1.2523 |
| daily change today | 0.0083 |
| today’s daily variation | 0.67 |
| today’s daily opening | 1,244 |
| Trends | |
|---|---|
| daily SMA20 | 1.2474 |
| daily SMA50 | 1.2444 |
| daily SMA100 | 1.2295 |
| daily SMA200 | 1.1987 |
| levels | |
|---|---|
| previous daily high | 1.2444 |
| previous daily low | 1.2348 |
| Previous Weekly High | 1.2472 |
| previous weekly low | 1.2308 |
| Previous Monthly High | 1,268 |
| Previous monthly minimum | 1.2308 |
| Fibonacci daily 38.2 | 1.2408 |
| Daily Fibonacci 61.8% 1.2385 | 1.2385 |
| Daily Pivot Point S1 | 1.2377 |
| Daily Pivot Point S2 | 1.2315 |
| Daily Pivot Point S3 | 1.2281 |
| Daily Pivot Point R1 | 1.2474 |
| Daily Pivot Point R2 | 1.2507 |
| Daily Pivot Point R3 | 1,257 |
Source: Fx Street
I am Joshua Winder, a senior-level journalist and editor at World Stock Market. I specialize in covering news related to the stock market and economic trends. With more than 8 years of experience in this field, I have become an expert in financial reporting.


