
- GBP/USD sinks more than 2%, weighed down by weaker-than-expected UK economic data.
- The aggressive monetary policy of the US Federal Reserve is a headwind for GBP/USD.
- US business activity contracted but showed signs of improvement.
- UK consumer confidence and business activity disappoint, raising fears of a deep UK recession.
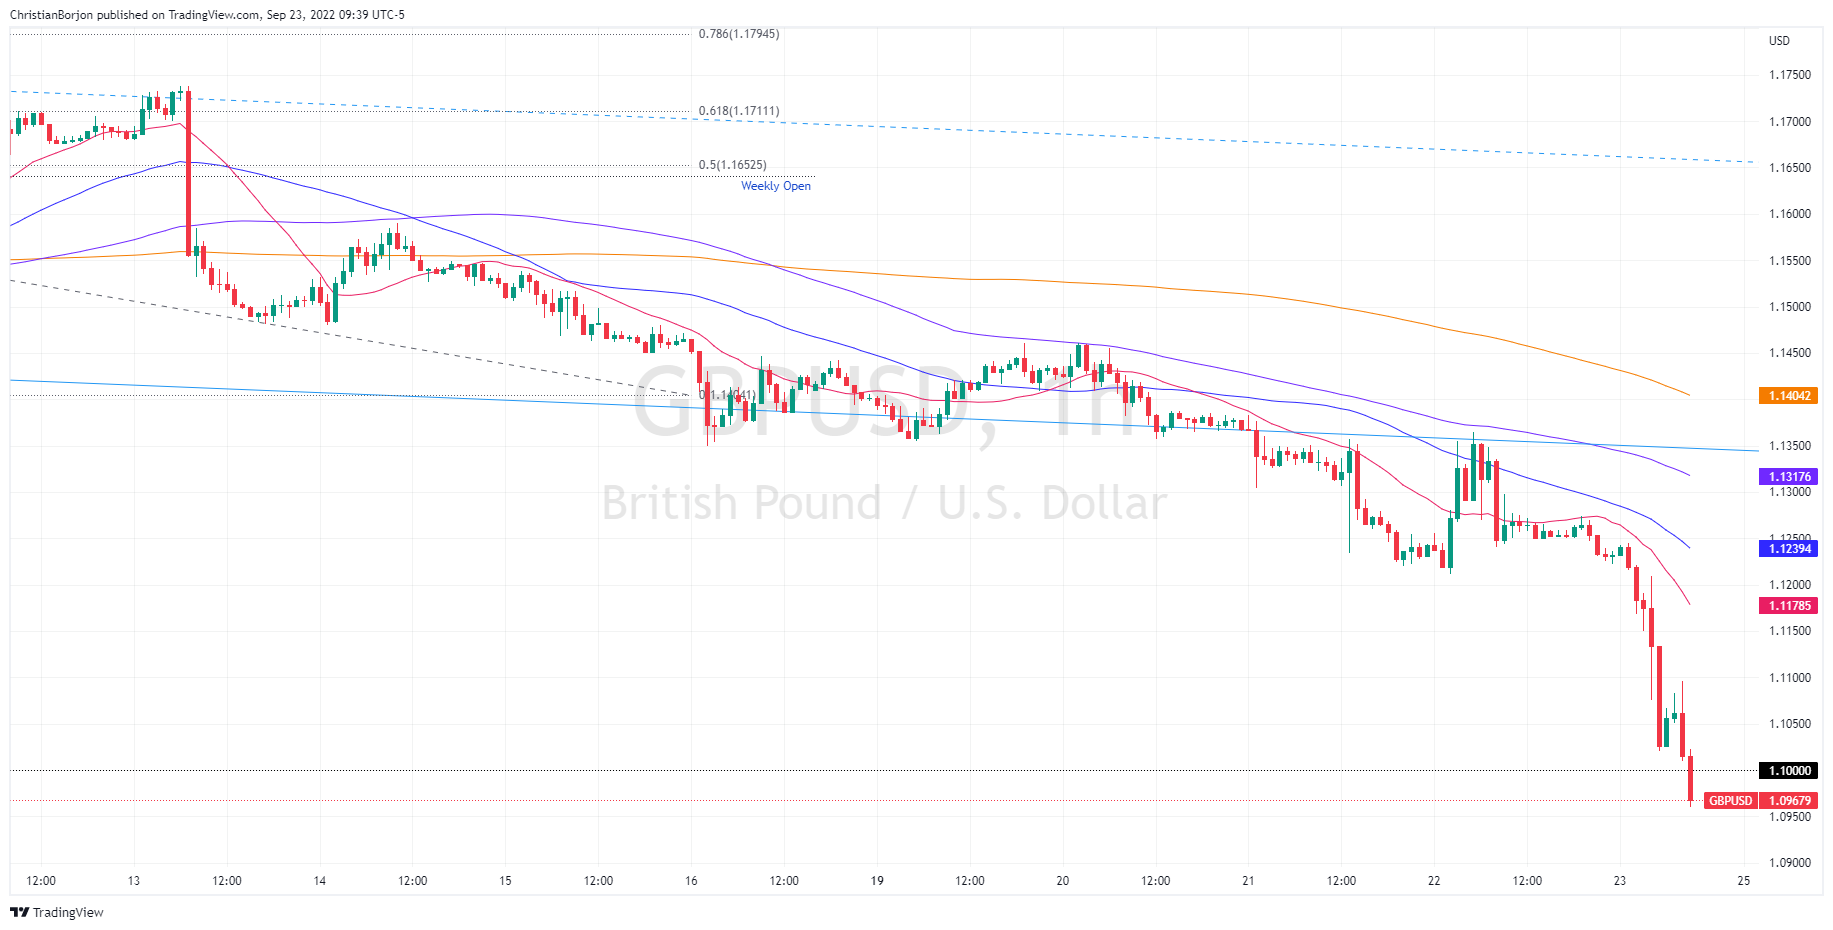
The GBP/USD is tumbling from 1.1200, with an eye on a break below the 1.1000 figure, last seen in March 1985, courtesy of dismal market sentiment, spurred on by central bank tightening in around the world to quell price pressures. GBP/USD is trading at 1.0965, down more than 2% from its opening price, after hitting a daily high of 1.1273.
Against the backdrop of the Federal Reserve raising interest rates by 75 basis points on Wednesday and signaling further hikes are on the way, investor fears have increased that this will hurt company earnings and could plunge the American economy in a recession. Meanwhile, US business activity contracted in September, as reported by S&P Global, although it showed some signs of recovery.
The S&P manufacturing PMI expanded above the 51 estimate, while the services index rose to 49.2 but fell short of the expansion level. Consequently, the composite index remained below 49, in contraction territory, but above estimates.
Outside of the US data, in the UK, GfK Consumer Confidence showed households feeling “exasperated” with double-digit UK inflation readings. The GfK index fell to an all-time low of -44, last seen in 1974.
S&P Global later released British PMIs for September, with the composite index dipping from 49.6 in August to 48.4, reigniting recession fears. “The UK’s economic woes deepened in September as falling business activity indicates the economy is likely in a recession,” said Chris Williamson, chief business economist at S&P Global.
In addition, the services index fell to 49.2 from 50.9 in August, while the manufacturing PMI rebounded from 47.3 to 48.5.
That said, GBP/USD has extended its losses on the day, reaching the 1.0985 level for the first time since 1985, opening the door for a retest of the March lows at 1.0545.
GBP/USD hourly chart
Technical levels
Source: Fx Street
With 6 years of experience, I bring to the table captivating and informative writing in the world news category. My expertise covers a range of industries, including tourism, technology, forex and stocks. From brief social media posts to in-depth articles, I am dedicated to creating compelling content for various platforms.


