
- GBP/USD sinks nearly 180 pips after high inflation data in the US.
- US consumer sentiment has slumped to a 5-decade low.
- GBP/USD Price Forecast: Short term to test decade low at 1.2155.
The GBP/USD slumps after a hotter-than-expected US inflation report and extends its losses on the week, falling from around 1.2500 to fresh three-week lows around 1.2320. At 1.2313, GBP/USD remains on the defensive and is expected to extend its downtrend heading into next week’s Fed policy meeting.
The pound plummets on expectations of aggressive Fed rate hikes
On Friday, the US Bureau of Labor Statistics (BLS) reported that the Consumer Price Index (CPI) for May increased by 8.6% year-on-year, above the estimate of 8.3%. Inflation excluding volatile items like food and energy, the so-called core CPI, also rose 6%, beating expectations. This is likely to put pressure on the Federal Reserve to act aggressively and raise interest rates more quickly, despite triggering a recession.
Analysts at TD Securities said the US inflation data should be of “major concern for the Federal Reserve” as both readings showed no signs of peaking; instead, inflation is widening, and they expect prices to continue rising. They added: “We expect the Fed to maintain its aggressive tightening bias in the coming months, we expect the Committee to raise rates by 50 basis points both next week and at the July FOMC meeting, and we believe a 50 basis point hike will basis points in September might not be ruled out.
Later, US consumer sentiment also delivered a disappointing reading, plummeting to its lowest level in 50 years, with the University of Michigan survey falling to 50.2 from 58.4 in May. The University of Michigan survey also includes inflation expectations, with a forecast of a 5.4% price increase for next year, higher than the 5.3% of the previous study. As for price expectations in the next five to ten years, the survey shows an advance of 3.3%.
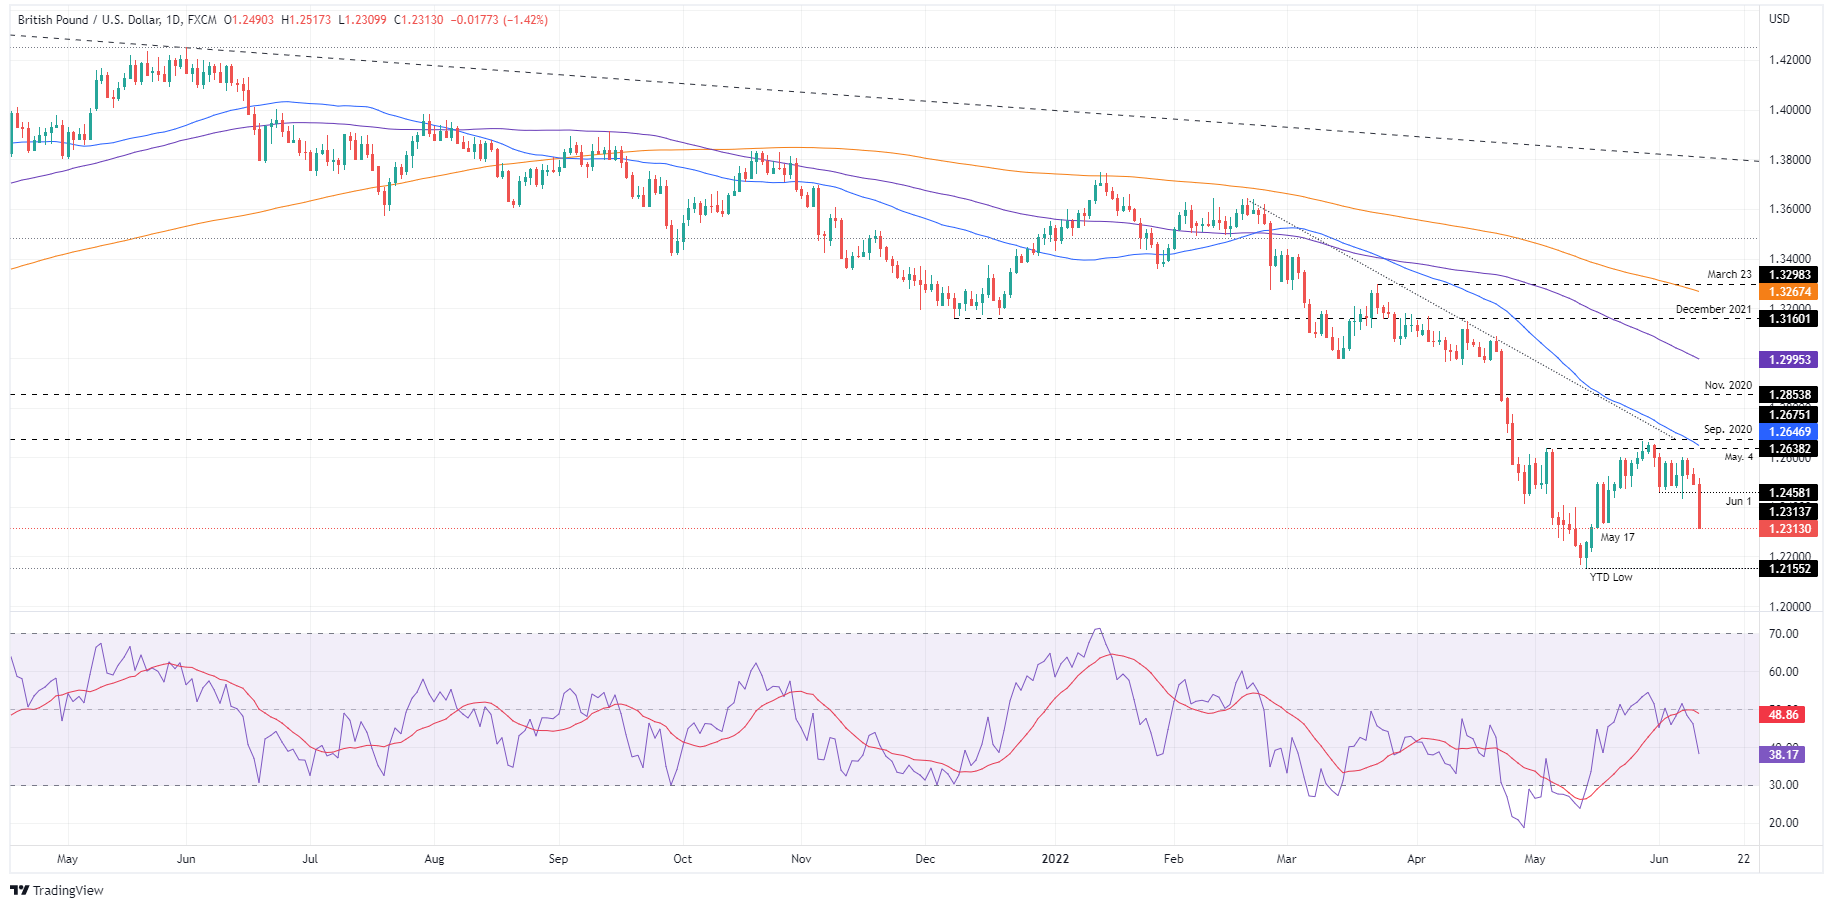
GBP/USD Price Forecast: Technical Outlook
GBP/USD is accelerating its downtrend and testing the daily low of May 17 at 1.2313. The Relative Strength Index (RSI) is heading lower, and despite the aggressive decline in GBP/USD, it still has enough room before reaching oversold readings.
The next GBP/USD support would be 1.2300. Once broken, the next support would be 1.2200, followed by the low for the year at 1.2155.
Technical levels
Source: Fx Street
With 6 years of experience, I bring to the table captivating and informative writing in the world news category. My expertise covers a range of industries, including tourism, technology, forex and stocks. From brief social media posts to in-depth articles, I am dedicated to creating compelling content for various platforms.


