
- US yields fall sharply, pushing the DXY lower.
- The markets try to stabilize amid the nervousness of the markets.
- GBP/USD rises for the fourth day in a row, with an eye on 1.2200.
The pair GBP/USD broke above 1.2150, reaching the highest level since mid-February, driven by a sharp drop in the Dollar Index (DXY). The sharp drop in US yields comes as investors shift bets to a more dovish Federal Reserve amid market concerns about banking.
DXY collapses before a new scenario
The Silicon Valley Bank bankruptcy and its effects boost markets. Major US indices are mixed on Monday, with sharp falls in the banking sector. The Dow Jones is at a four-month low.
The current situation has lowered the odds of a 50 basis point rate hike by the Federal Reserve next week and has sent US yields sharply lower. The February Consumer Price Index will be released in the US on Tuesday, a key piece of data, now offset by recent events. Prior to the SVB collapse, higher-than-expected inflation numbers would have cemented the exceptions to a 50 basis point rate hike, but now the situation is more complex as market participants anticipate a dovish Fed.
US yields are falling sharply at a rate not seen in years. The 10-year US bond yield topped 4% last week and bottomed at 3.42% on Monday. Falling yields have weakened the dollar against its main European competitors. The DXY has fallen almost 1%, reaching its lowest level in four weeks.
The ramifications of the US banking crisis crossed the Atlantic. In the UK, the Government and the Bank of England facilitated a deal for HSBC to buy Silicon Valley Bank UK for £1. On Tuesday, before the US CPI, the UK will release employment figures.
GBP/USD is trading at monthly highs at 1.2176, with strong bullish momentum. To the upside, the next resistance zone is at 1.2200. The pair is retrieving the 20-day simple moving average (SMA). The area of 1.2100 and 1.2060 have become relevant support levels.
GBP/USD daily chart
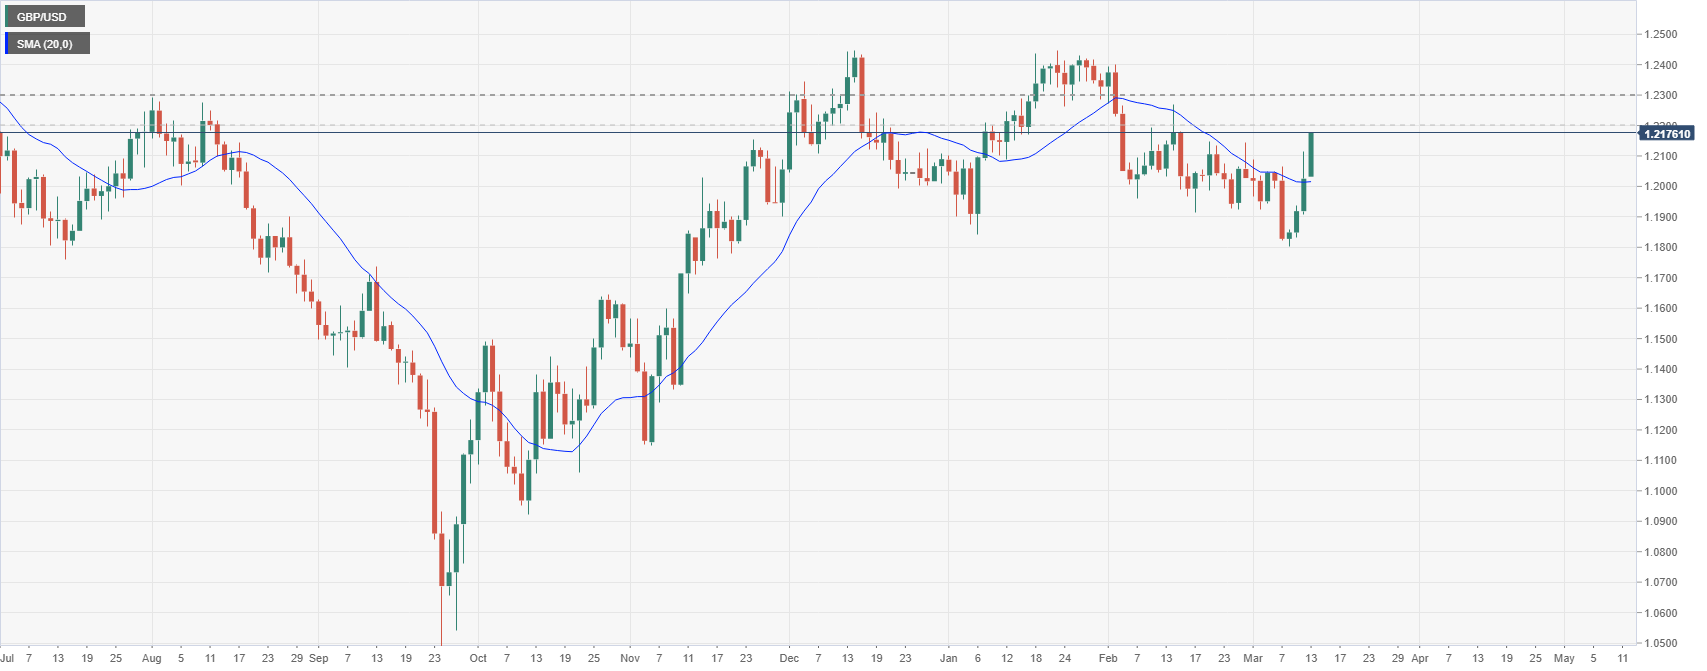
Source: Fx Street
I am Joshua Winder, a senior-level journalist and editor at World Stock Market. I specialize in covering news related to the stock market and economic trends. With more than 8 years of experience in this field, I have become an expert in financial reporting.


