
- GBP/USD stuck near an important psychological level with central bank double rate calls on the barrel.
- This week’s busy economic calendar promises plenty of volatility.
- The pair could turn in the middle of the week.
This week, the pair GBP/USD will have a big role, as both the Federal Reserve (Fed) and the Bank of England (BoE) will announce their interest rates in the middle of the week, and the British pound (GBP) is struggling to position itself against the US dollar, while the investors take positions.
The Fed is expected to keep rates at 5.5% at the next Federal Open Market Committee (FOMC) meeting on Wednesday at 18:00 GMT, while the Bank of England is expected to make a final hike of rates of 25 basis points, taking the UK main rate to 5.5% from 5.25%.
On Thursday, at 11:00 GMT, the Bank of England will announce its interest rate decision.
Lots of economic data in the US and the UK
GBP/USD will have a week full of economic data. In the UK, Consumer Price Index (CPI) figures will be released on Wednesday, the Bank of England will be released on Thursday, and retail sales and the preliminary Purchasing Managers’ Index (PMI) will be released on Friday.
On Wednesday, the UK CPI is expected to rise from -0.4% to 0.7%, while Friday will see the release of August retail sales, which are forecast to rise to 0.5% following the previous month’s decline of 1.2%.
As for the US agenda, Wednesday’s Fed numbers will be followed by Thursday’s employment numbers and Friday’s preliminary PMI.
Initial jobless claims for the week ending September 15 and the Philadelphia Manufacturing Survey for September will be released on Thursday at 12:30 GMT. The latest number of initial jobless claims was 220,000, and the manufacturing survey is expected to decline 0.7% from the last data of 12.
Friday’s preliminary PMI figures, due to be released at 13:45 GMT, are expected to show a slight decline, with the manufacturing PMI at 47.8 from 47.9 previously, and the services sector PMI at 50.5 from 50.3 previously. .
GBP/USD Technical Outlook
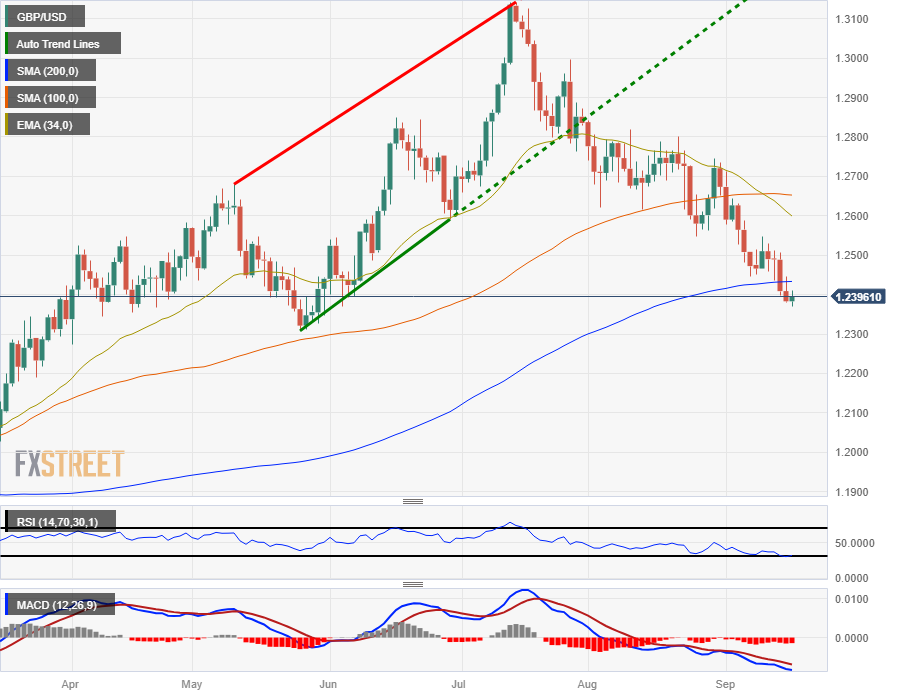
From a technical point of view, the GBP/USD pair is trading sideways at the beginning of the week. The pair opened the week near the 1.2400 area and has struggled to find momentum so far. Intraday, the pair moves between 1.2400 and 1.2380.
GBP/USD has closed lower or sideways for eight of the last nine consecutive weeks from the early July high at 1.3142, and daily candlestick charts see the pair decidedly bearish, sliding just below the moving average of 200-day SMA currently parked near 1.2433.
The 34-day EMA has turned bearish at the 1.2600 level, and as long as the markets remain balanced, traders will want to keep an eye on the release of the Relative Strength Index (RSI) and convergence indicators. moving average divergence (MACD), which are showing oversold conditions on the daily candles.
GBP/USD daily chart
GBP/USD technical levels
Source: Fx Street
I am Joshua Winder, a senior-level journalist and editor at World Stock Market. I specialize in covering news related to the stock market and economic trends. With more than 8 years of experience in this field, I have become an expert in financial reporting.


 music")
