
- GBP/USD is holding decent gains around 1.2070, but below the 200 day EMA.
- Chicago’s manufacturing PMI beat estimates but remains in contractionary territory.
- GBP/USD Price Analysis: Bullish bias, but you need to break above the 200 day EMA to extend your gains.
The pound sterling (GBP) cut its losses against the US dollar (USD) as risk aversion dominated the final trading day of 2022. Wall Street extended its losses, while lack of news kept GBP/USD within known exchange rates . At time of writing, GBP/USD is trading at 1.2079 after testing daily lows of 1.2009.
US stocks continued to fall amid lack of news. The Chicago Purchases Manufacturing Index (PMI) for December beat estimates of 40.5 to 44.9 but remained in contractionary territory. According to sources cited by MarketWatch, the manufacturing sector is suffering from the slowdown in demand, spurred on by the weakness of the world economy and the backlog of orders due to the pandemic.
Meanwhile, the lack of economic data in the UK economic calendar keeps investors adrift on the latest developments related to the UK energy crisis. According to the Times, Britain’s Chancellor of the Exchequer, Jeremy Hunt, has been weighing how much aid to provide companies when a six-month, £18bn energy support program expires in March 2023.
For its part, the Dollar Index, an indicator of the value of the dollar against a basket of six currencies, extended its losses to 0.40%, standing at 103,560, against the current of the yields of US Treasury bonds, which represented a tailwind for GBP/USD. The reference rate on 10-year US bonds rises seven and a half points to 3.894%.
Looking ahead to next week, the UK economic calendar will see the S&P Global/CIPS Manufacturing PMI released on Tuesday. In the US, the agenda will include the S&P Global Manufacturing PMI.
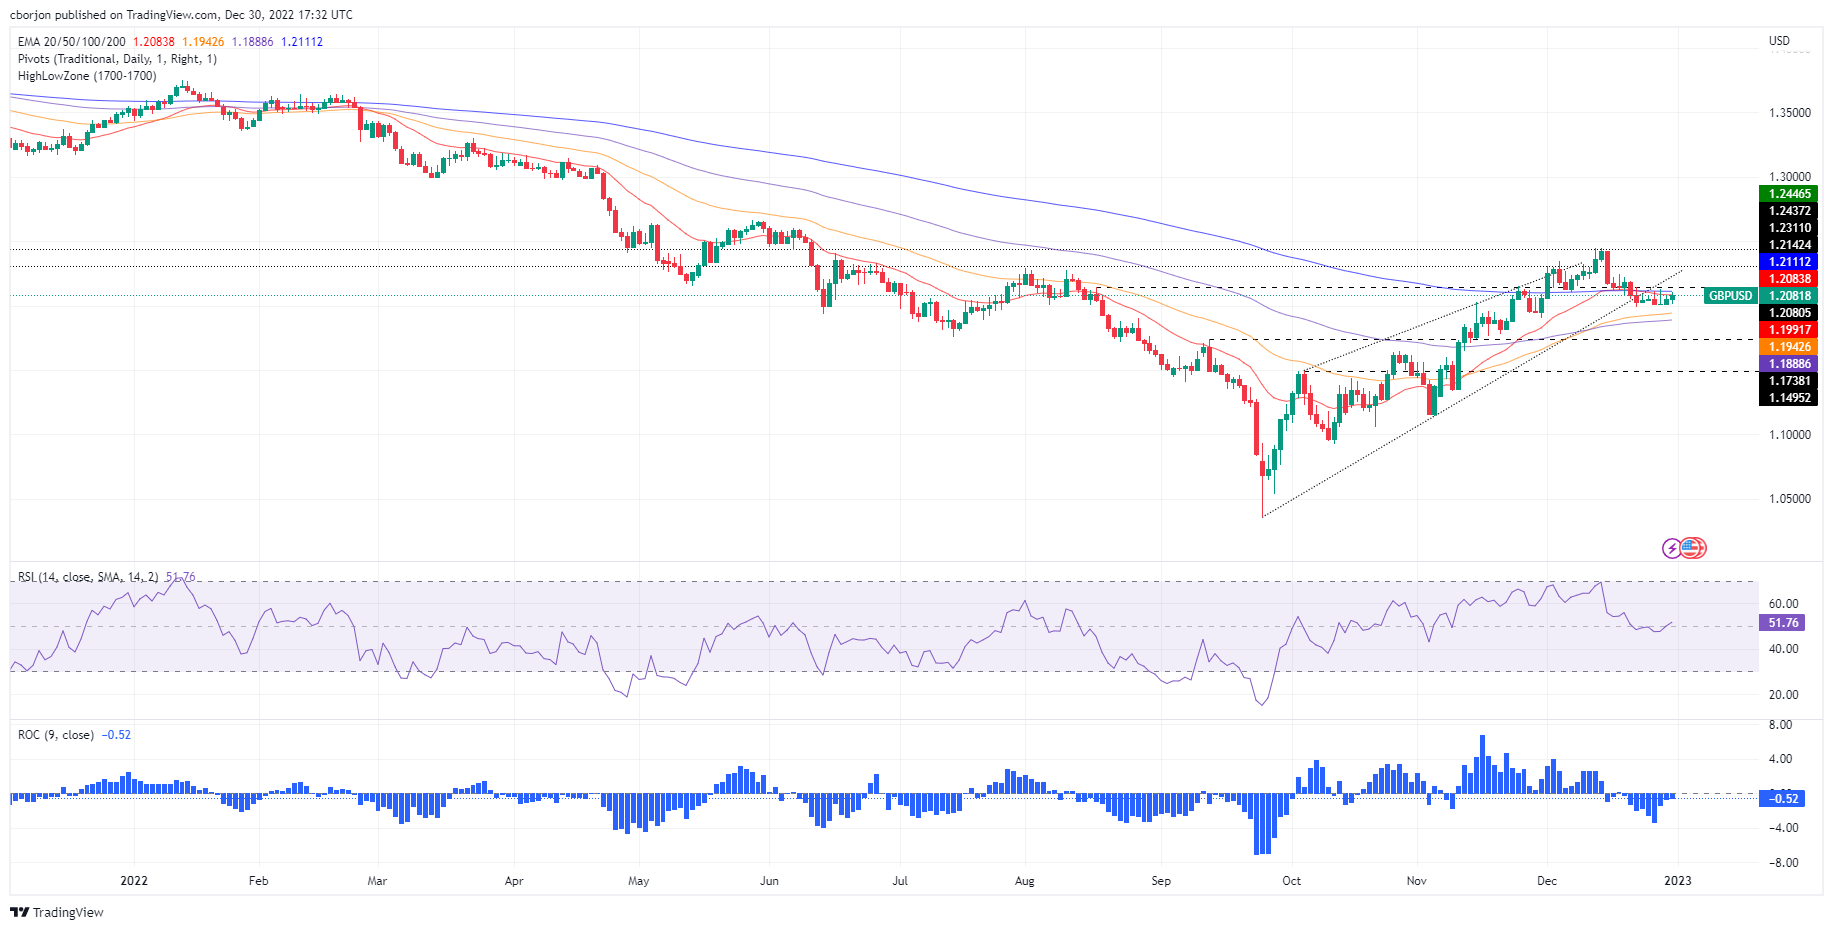
GBP/USD Price Analysis: Technical Perspective
The daily chart shows the GBP/USD consolidating ahead of the coming year. The 200 day EMA at 1.2111 is proving to be tough resistance to overcome, while GBP/USD buyers are defending 1.2000. The Relative Strength Index (RSI) points higher after crossing the midline of 50, while the Rate of Change (RoC) shows diminishing selling pressure.
Therefore, GBP/USD has a neutral bias to the upside, with its first resistance being the 200 day EMA at 1.2111. Breaking above will expose the December 19 daily high at 1.2242, followed by the 1.2300 figure. As an alternate scenario, the 1.2000 figure is the first line of defense for GBP buyers. Once broken, the next support would be the 50 day EMA at 1.1942, followed by 1.1900.
Source: Fx Street
I am Joshua Winder, a senior-level journalist and editor at World Stock Market. I specialize in covering news related to the stock market and economic trends. With more than 8 years of experience in this field, I have become an expert in financial reporting.


