
- GBP/USD bulls take a breath in the key demand zone.
- The bears must stay in front of the dynamic resistance.
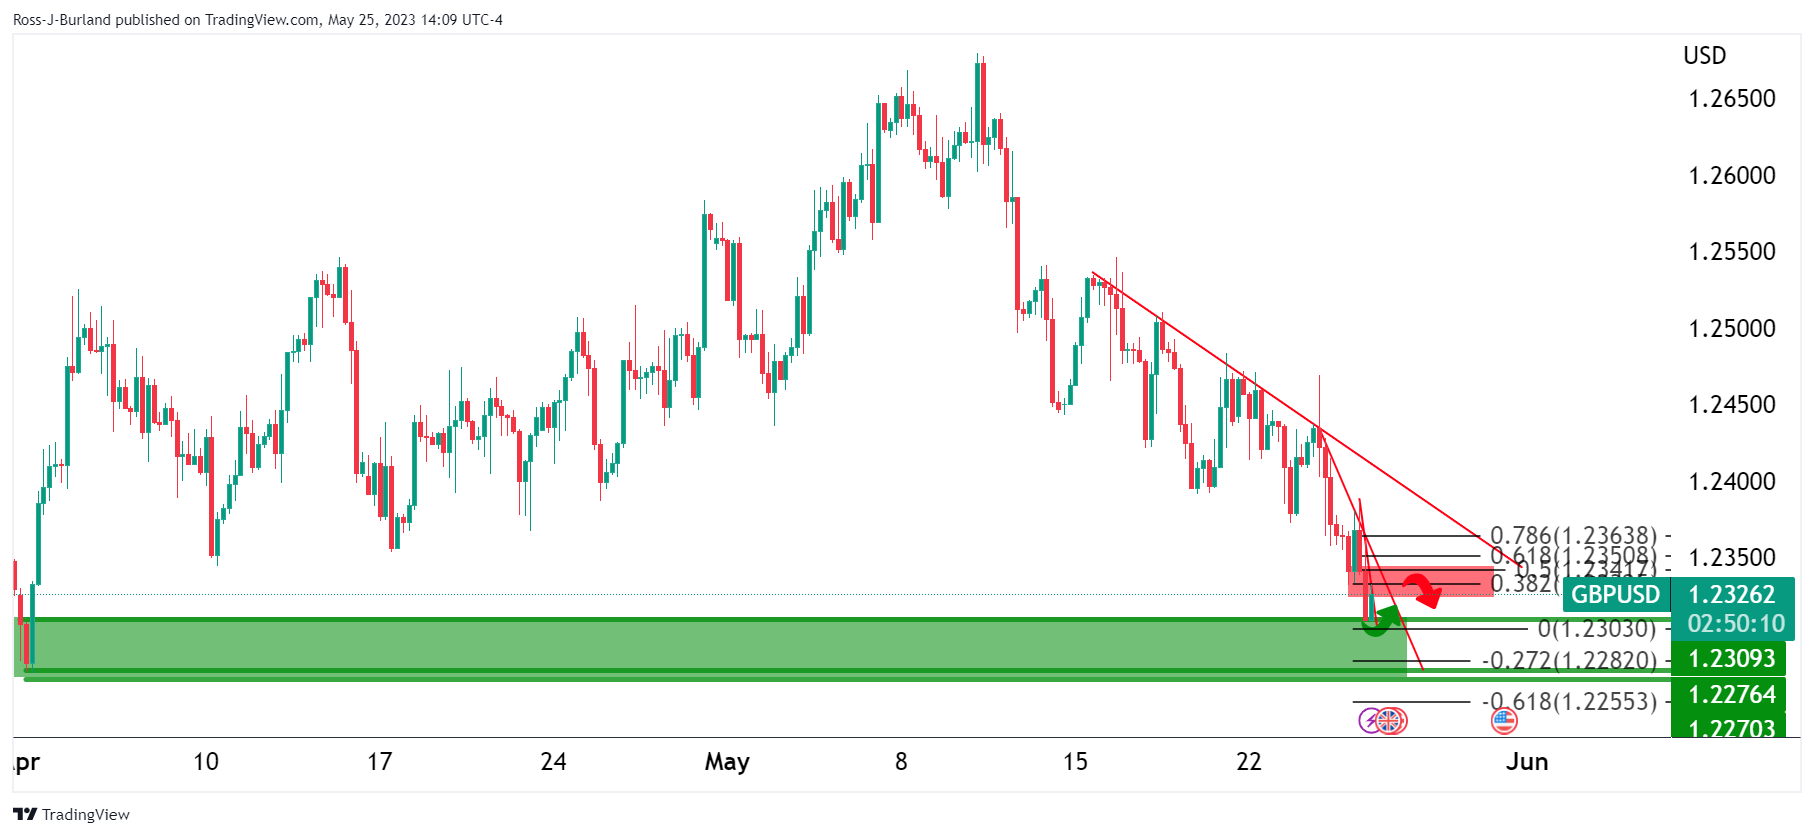
GBP/USD is down on the day and is currently trading at 1.2330. The pair has traveled from a high of 1.2387 to a low of 1.2308 thus far. He price is moving towards a potential support area, but while at the forefront of the downtrend, the bears are in control and there is prospect of a continuation lower if the bears commit. Illustrated below are a couple of scenarios that respect dynamic resistance lines and also the horizontal support area:
GBP/USD 4-hour chart
The market has corrected and the question is whether the bears are going to stay engaged.
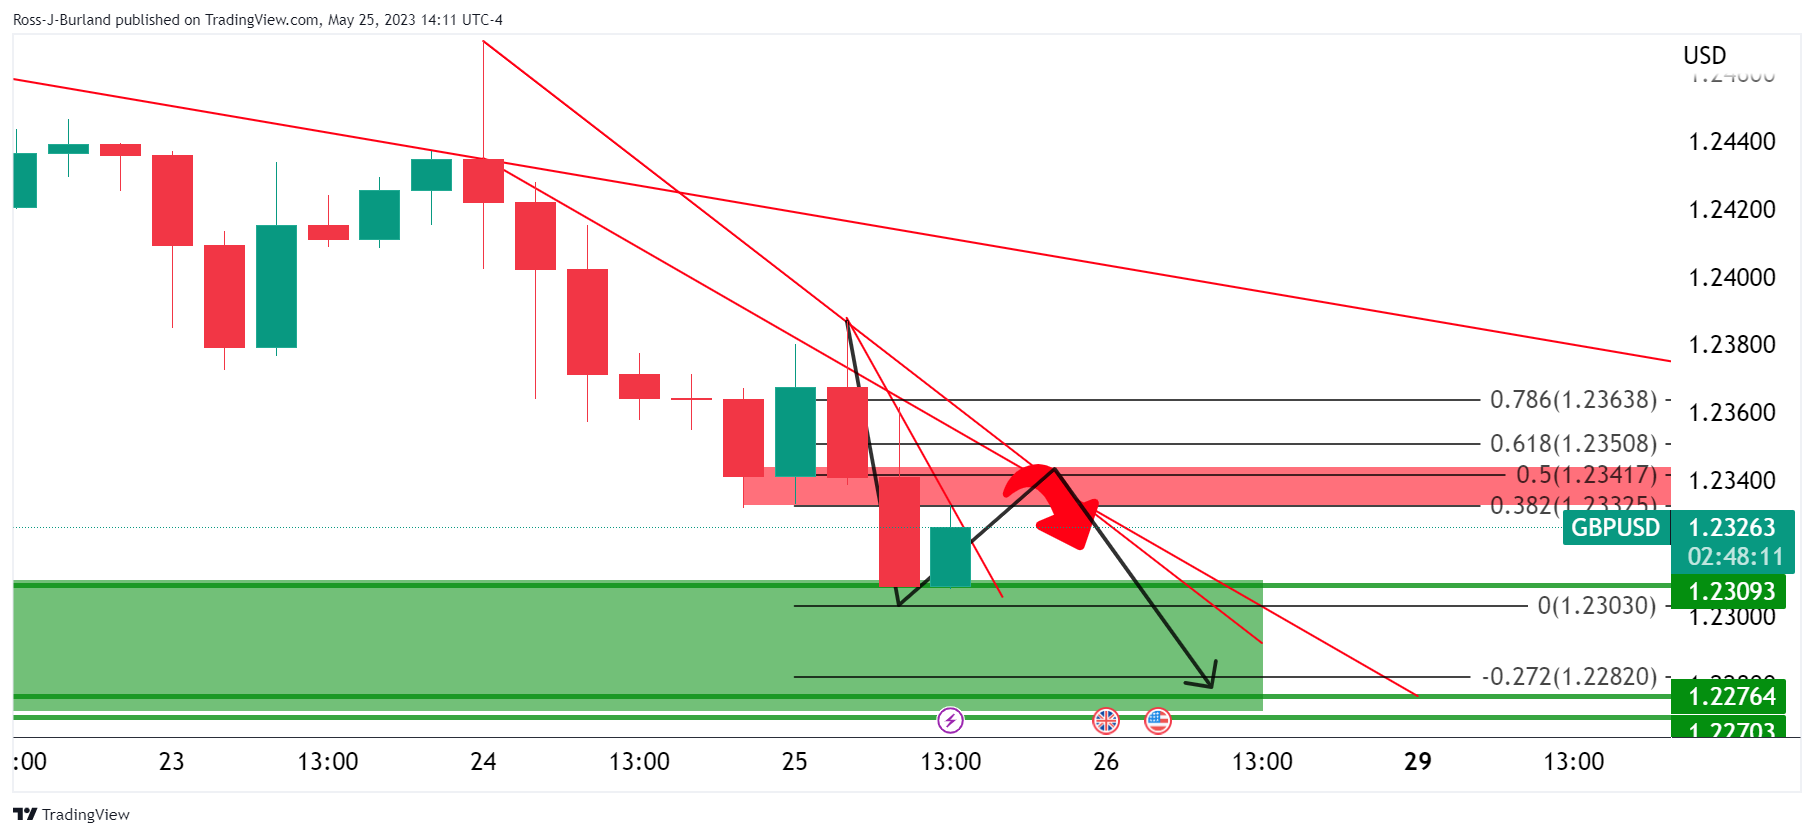
If the bears recommit, we have the 38.2% Fibonacci and 50% mean reversion resistance zone that they could lean on.
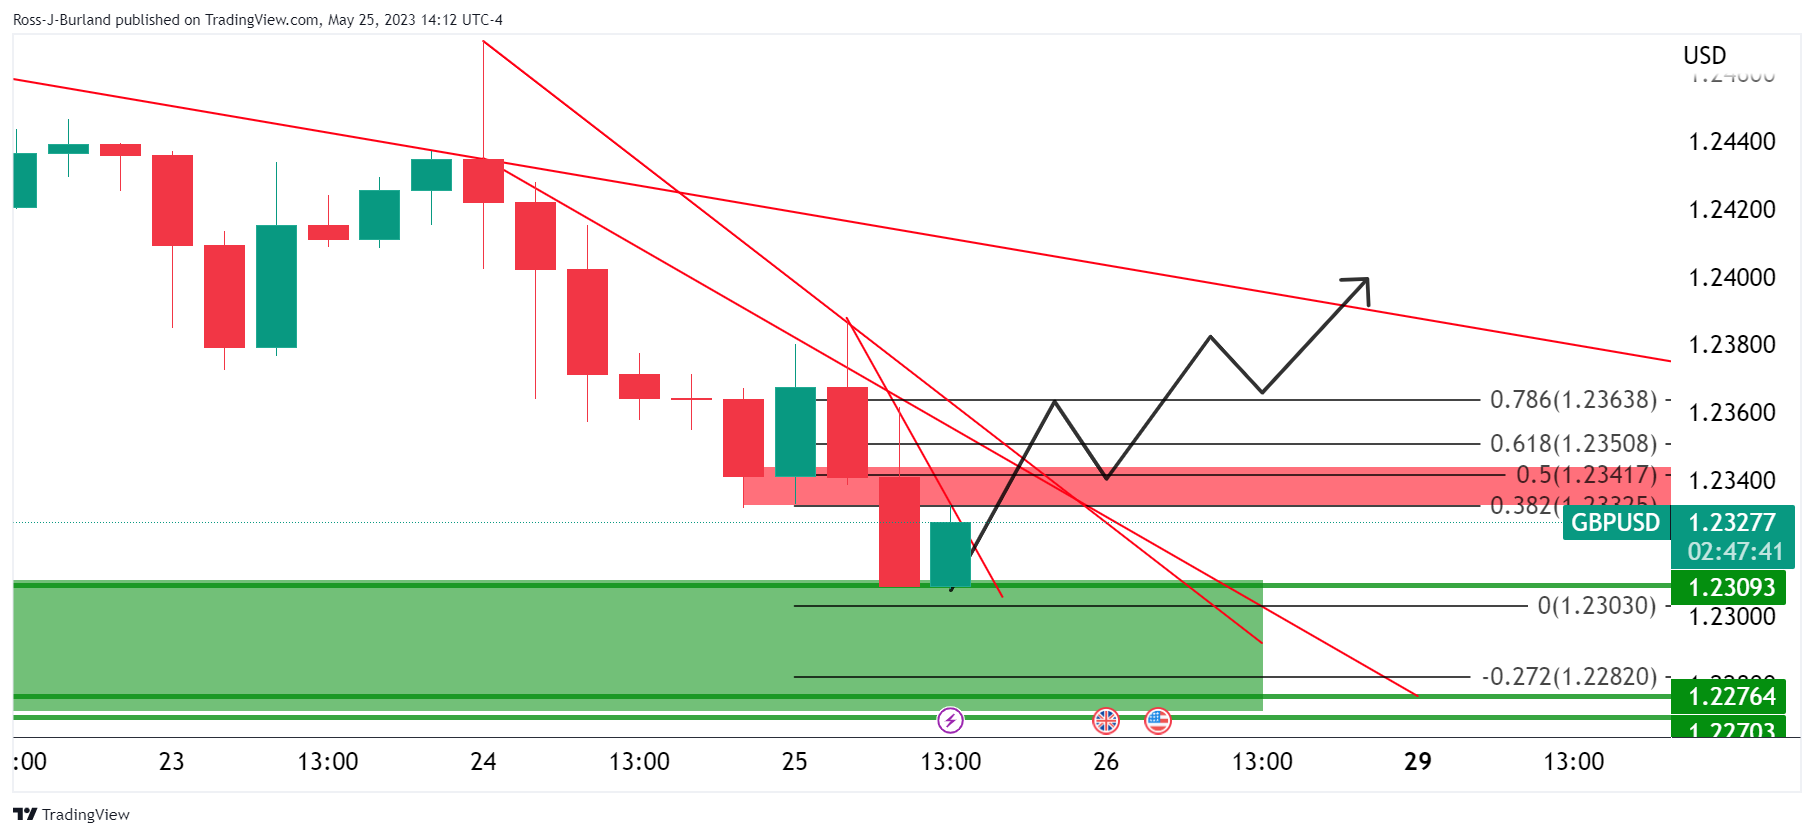
On the other hand, if this zone were to break, then the bulls would take over and the bullish pattern could unfold with the trend line resistance looking vulnerable.
Source: Fx Street
I am Joshua Winder, a senior-level journalist and editor at World Stock Market. I specialize in covering news related to the stock market and economic trends. With more than 8 years of experience in this field, I have become an expert in financial reporting.


