
- GBP/USD dips modestly lower for the second consecutive session.
- Technicals indicate a loss of buying momentum as the RSI approaches the 50 midline.
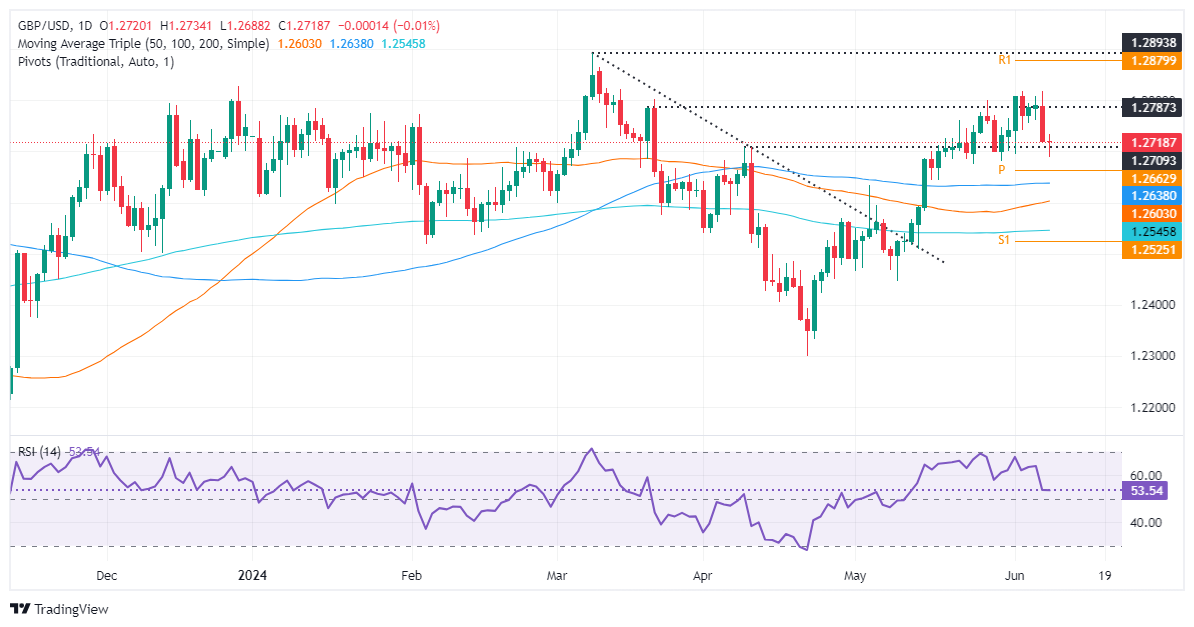
- A drop below 1.2700 could push GBP/USD towards key moving averages near 1.2686 and potentially lower.
- To the upside is seen above 1.2750, with buyers targeting 1.2800.
The British Pound extended its losses for the second consecutive trading session against the US Dollar, following last Friday’s impressive US jobs report, which increased the likelihood of a less dovish Federal Reserve. That and uncertainty over the next Fed meeting would keep the Pound under pressure. Therefore, GBP/USD is trading at 1.2713, down 0.01%
GBP/USD Price Analysis: Technical Outlook
After struggling around 1.2800 with key technical resistance levels, GBP/USD fell below 1.2700 and marked a new seven-day low of 1.2687 before regaining some ground.
Although momentum still favors buyers, the RSI fell sharply towards the midline of 50, hinting that buyers are losing momentum. However, Monday’s price action appears to form a ‘dragonfly doji’, a bullish candlestick.
If GBP/USD recovers 1.2750, it will be possible to challenge the June 7 high of 1.2813. Once cleared, the next resistance line will be 1.2850, followed by 1.2900.
Conversely, if GBP/USD closes daily below 1.2700, that would support a decline towards the confluence of the 100-day moving average (DMA) around 1.2686, before the 50- and 200-day DMAs at 1.2602 and 1.2543. , respectively.
GBP/USD Price Action – Daily Chart
Source: Fx Street
I am Joshua Winder, a senior-level journalist and editor at World Stock Market. I specialize in covering news related to the stock market and economic trends. With more than 8 years of experience in this field, I have become an expert in financial reporting.


