
- GBP/USD drops 0.32% as BoE cuts rates to 5.25% in a tight 5-4 vote.
- The technical outlook suggests a possible bounce, forming a ‘hammer’ pattern.
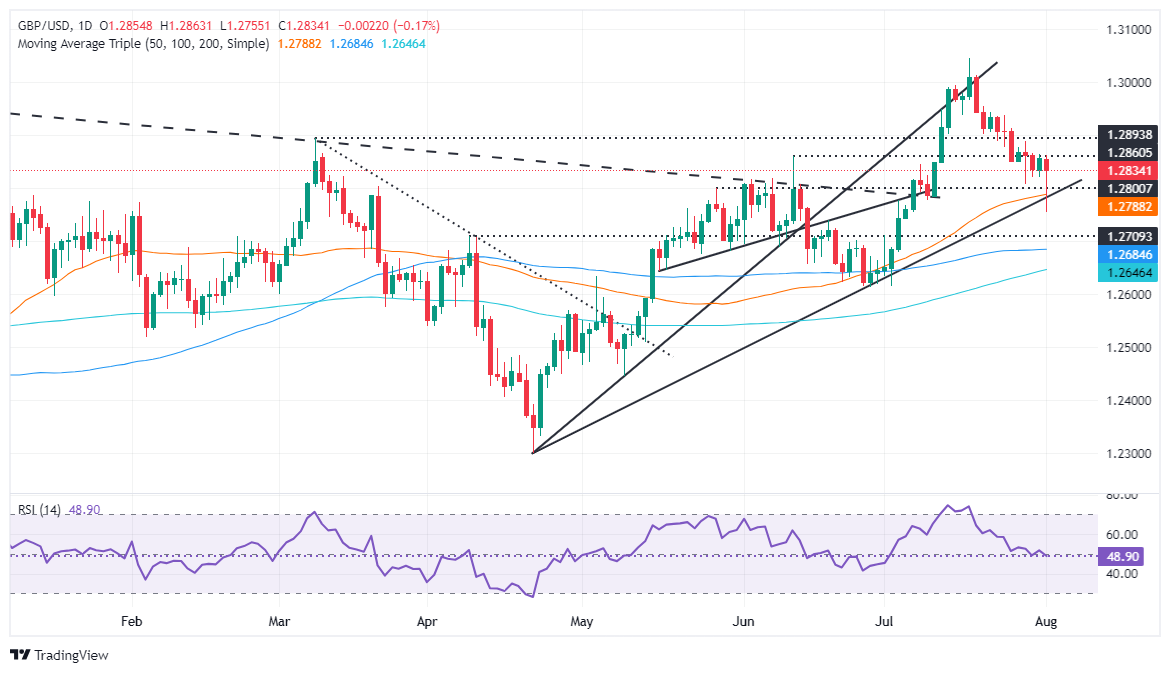
- Key resistance levels at 1.2888, 1.2900 and 1.2937; support levels at 1.2786, 1.2750 and 1.2700.
The British Pound is under pressure in early trade during the North American session, falling around 0.12% after the Bank of England (BoE) cut interest rates to 5.25% in a tight 5-4 vote. Following the decision, GBP/USD fell to its lowest level of 1.2750, but has recovered somewhat, paring some of its losses. The pair is trading at 1.2837 at the time of writing.
GBP/USD Price Analysis: Technical Outlook
Following the BoE decision, GBP/USD looks to form a ‘hammer’ preceded by a 2.20% drop, which could open the door to rise above the 1.2900 figure and retest the 1.3000 figure. Although BoE Governor Bailey and his team reduced borrowing costs, policy remains restrictive as they revised up their inflation expectations to 2.25%.
If GBP/USD breaks above the current week’s high at 1.2888, that could exacerbate a rally towards 1.2900, followed by the final pivot high at 1.2937, the high of July 24. A break of the latter will expose 1.3000.
For a bearish continuation, sellers need to push prices and achieve a daily close below the 50-day moving average (DMA) at 1.2786. Once overcome, the next support would be the August 1 low of 1.2750, followed by 1.2700 and the 100-day SMA at 1.2683.
GBP/USD Price Action – Daily Chart
Pound Sterling PRICE Today
The table below shows the exchange rate of the British Pound (GBP) against major currencies today. British Pound was the strongest currency against the British Pound.
| USD | EUR | GBP | JPY | CAD | AUD | NZD | CHF | |
|---|---|---|---|---|---|---|---|---|
| USD | 0.10% | 0.15% | 0.15% | 0.02% | -0.20% | -0.44% | -0.42% | |
| EUR | -0.10% | 0.06% | 0.05% | -0.09% | -0.29% | -0.53% | -0.52% | |
| GBP | -0.15% | -0.06% | -0.02% | -0.14% | -0.35% | -0.60% | -0.58% | |
| JPY | -0.15% | -0.05% | 0.02% | -0.15% | -0.37% | -0.66% | -0.63% | |
| CAD | -0.02% | 0.09% | 0.14% | 0.15% | -0.21% | -0.45% | -0.44% | |
| AUD | 0.20% | 0.29% | 0.35% | 0.37% | 0.21% | -0.24% | -0.23% | |
| NZD | 0.44% | 0.53% | 0.60% | 0.66% | 0.45% | 0.24% | 0.02% | |
| CHF | 0.42% | 0.52% | 0.58% | 0.63% | 0.44% | 0.23% | -0.02% |
The heatmap shows percentage changes of major currencies. The base currency is selected from the left column, while the quote currency is selected from the top row. For example, if you choose the British Pound from the left column and move along the horizontal line to the US Dollar, the percentage change shown in the chart will represent the GBP (base)/USD (quote).
Source: Fx Street
I am Joshua Winder, a senior-level journalist and editor at World Stock Market. I specialize in covering news related to the stock market and economic trends. With more than 8 years of experience in this field, I have become an expert in financial reporting.


