
- GBP/USD weakens near multi-month lows at the start of the European session on Tuesday.
- The recent break of the 200-day SMA supports the prospects for further further losses.
- The bears seem reluctant to open new positions ahead of key central bank decisions.
The GBP/USD pair continues its struggle to gain significant traction and weakens near its lowest level since early June touched on Monday. The pair is moving around the 1.2380-1.2375 area and seems vulnerable to the extension of the bearish trajectory of the last two months.
Firm expectations that the Bank of England (BoE) is nearing the end of its rate raising cycle continue to undermine the British Pound (GBP) and act as a headwind for the GBP/USD pair. The US dollar, for its part, remains defensive below the six-month high reached last week and helps limit the pair’s losses. Traders also seem reluctant to open aggressive positions, preferring to wait on the sidelines ahead of this week’s key central bank events: Wednesday’s long-awaited FOMC decision and Thursday’s crucial Bank of England meeting.
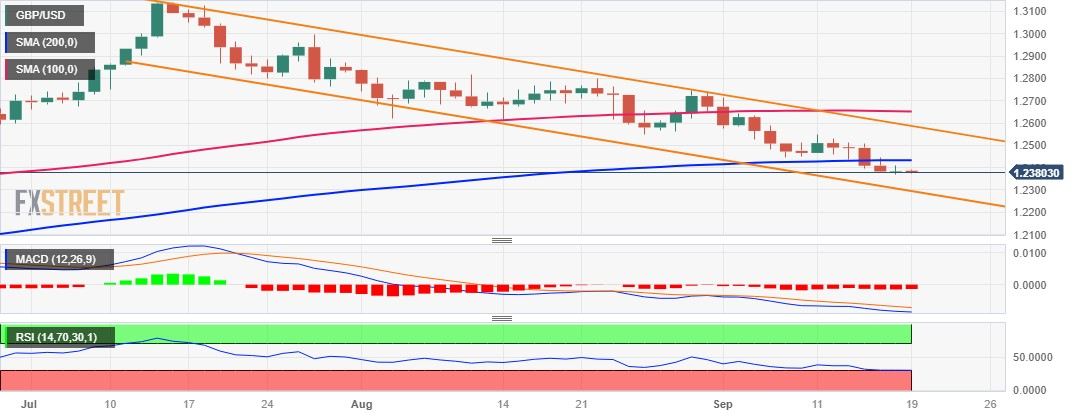
From a technical point of view, the recent decline along a descending channel points to a well-established short-term downtrend. Furthermore, last week’s breakout of the important 200-day SMA – for the first time since March – was seen as a new trigger for the bears. The subsequent slide and acceptance below the round level of 1.2400 validates the negative outlook. This, along with the negative oscillators on the daily chart, suggests that the path of least resistance for the GBP/USD pair remains to the downside.
Therefore, a pullback towards the 1.2310-1.2300 area, where the May monthly low occurred, is likely. This zone also coincides with the lower limit of the aforementioned trend channel, which if broken decisively will set the stage for an extension of the depreciation movement. The GBP/USD pair could then accelerate the decline towards the test of the round 1.2200 level before finally falling to the next relevant support near the 1.2150-1.2140 horizontal zone.
On the other hand, any recovery above the 1.2400 level will likely face strong resistance near the 1.2430-1.2435 region, or the 200-day SMA. Sustained strength above that region could trigger a short-covering rally and allow the GBP/USD pair to reclaim the psychological level of 1.2500. The recovery momentum could extend further, although it could still be seen as a selling opportunity and risks fading quite quickly near last week’s high, around the 1.2545-1.2550 area. The latter should serve as a reference point for short-term traders.
A convincing breakout will suggest that the GBP/USD pair has formed a short-term bottom and pave the way for some significant appreciating move. The pair could rise to the 1.2600 area, which represents the upper boundary of the descending channel. Below is the 100-day SMA barrier, currently around the 1.2645 area, which if broken decisively could shift the short-term bias in favor of the bulls.
GBP/USD daily chart
GBP/USD additional technical levels
Source: Fx Street
I am Joshua Winder, a senior-level journalist and editor at World Stock Market. I specialize in covering news related to the stock market and economic trends. With more than 8 years of experience in this field, I have become an expert in financial reporting.


