
- GBP/USD gains more than 0.40%, bouncing off daily lows after US economic growth in the first quarter disappointed expectations.
- Mixed signals from the US economy support the rise of the British Pound.
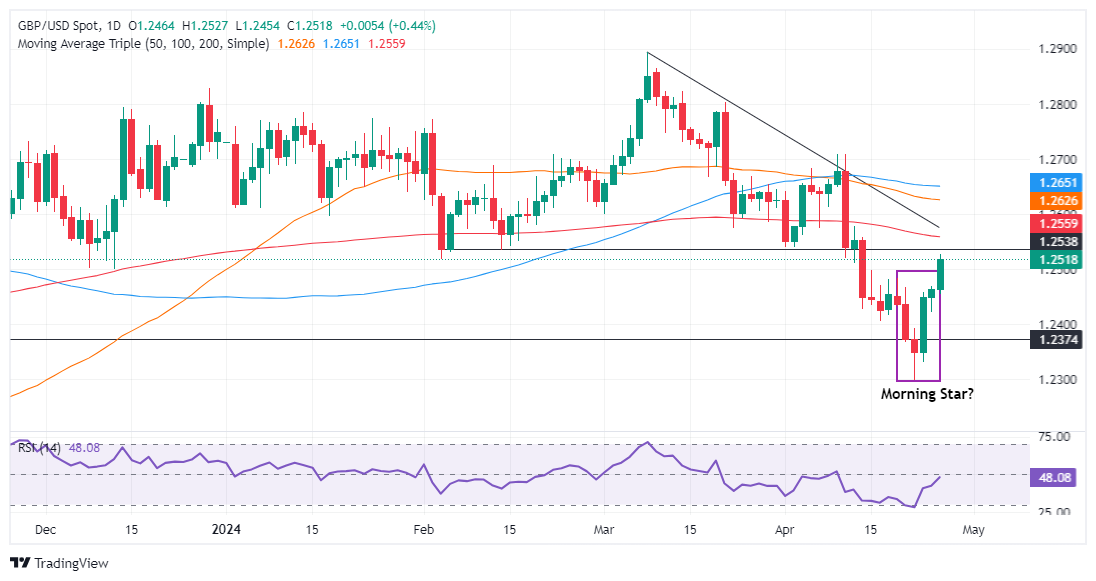
- Technical Outlook: Key resistance at 1.2559 with potential to reach April 9 high at 1.2709 if bullish momentum continues.
The British Pound resumed its advance against the US Dollar, rising more than 0.40% and trading at 1.2518. During the day, GBP/USD rebounded from daily lows of 1.2450 following the release of mixed economic data from the United States. The US economy in the first quarter of 2024 grew below estimates, which would justify an easing of monetary policy. However, the rise in prices encouraged investors' reaction to the forecast of rate cuts in 2024.
GBP/USD Price Analysis: Technical Insights
The GBP/USD pair is pointing up, although it maintains a bearish bias. Although the major remains far from the last cycle high, if buyers reclaim some key resistance levels, that would ultimately expose the April 9 high at 1.2709, the last cycle high.
Therefore, the first resistance for GBP/USD would be the 200-day moving average (DMA) at 1.2559. A break of the latter would expose the 1.2600 figure, followed by the 50-day and 100-day DMAs, each at 1.2624 and 1.2647. Once these levels are surpassed, the next objective would be the maximum of April 9.
On the other hand, if the GBP/USD pair falls below 1.2500, the downtrend would remain intact and pave the way to retest the yearly low of 1.2299.
GBP/USD Price Action – Daily Chart
Source: Fx Street
I am Joshua Winder, a senior-level journalist and editor at World Stock Market. I specialize in covering news related to the stock market and economic trends. With more than 8 years of experience in this field, I have become an expert in financial reporting.


