
- UK inflation remains at 40-year high and up 9.1% year-on-year.
- Fed Chairman Powell commented that the central bank is committed to lowering inflation, although he accepted that higher interest rates could cause a recession.
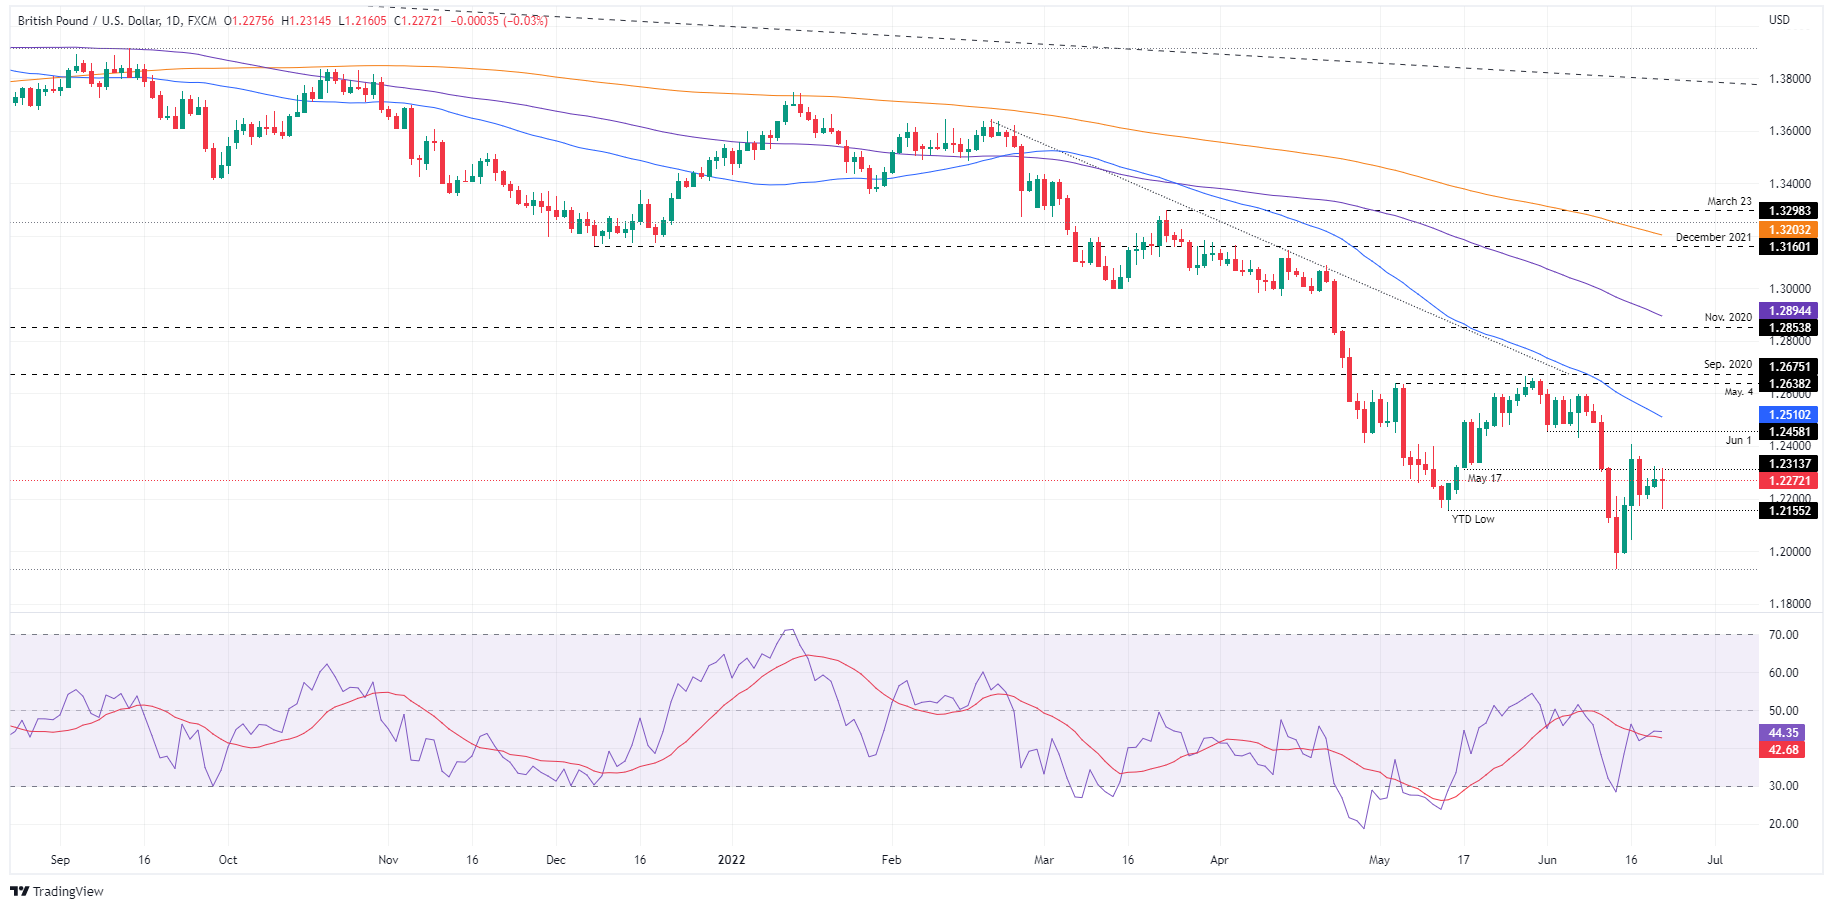
- GBP/USD Price Forecast: In the short term with a bullish bias.
The GBP remains on the defensive and is lower on Wednesday, with a low of 0.04% in the American session. In 1.2272, the GBP/USD remains below 1.2300, despite hotter-than-expected British inflation, while US Federal Reserve Chairman Jerome Powell testifies in the US Senate.
GBP/USD hit daily lows around 1.2160 during the day, but recovered some ground later, posting a daily high at 1.2314. Inflation in the UK hit a 40-year high of 9.1% year-on-year, driving the pound down. Traders should remember that the Bank of England (BoE) forecast inflation to hit 11% and projected a contraction by 2023.
Financial analysts have priced in a 25 basis point rate hike by the BoE at its August meeting. The odds of a 50bp rate hike by the BoE stand at 81%, according to STIRs.
Meanwhile, US Federal Reserve Chairman Jerome Powell is grabbing headlines. In his opening speech, he said the Fed is “strongly committed to bringing inflation back down.” In addition, he stated that data and decisions will determine the pace of rate hikes, which will be done “meeting by meeting.”
Powell also acknowledged that raising rates could push the US economy into recession, saying a soft landing would be “very difficult.”
Meanwhile, the US Dollar Index, a gauge of the dollar’s value against a basket of six currencies, remains on the defensive, down 0.34% to 104,063, while the 10-year Treasury yield years did not receive support from Powell, down twelve basis points, trading at 3.162%.
In the coming week, the UK economic docket will reveal the S&P Global/CIPS manufacturing, services and composite PMIs. Across the pond, the US calendar will include Fed chief Jerome Powell’s second day at the US Congress, initial jobless claims and S&P global PMIs.
GBP/USD Price Forecast: Technical Outlook
The GBP/USD daily chart shows that the major currency continues to have a bearish bias. However, price action over the past five days is consolidating around the 1.2156-1.2300 range after the pair jumped from year lows. This coupled with the Relative Strength Index (RSI), albeit in bearish territory, is starting to head higher.
That being said, GBP/USD’s short-term path of least resistance is to the upside. The first major resistance would be 1.2300. A break above would expose the June 16 high at 1.2406, followed by the 50-day moving average (DMA) at 1.2510.
Technical levels
Source: Fx Street
With 6 years of experience, I bring to the table captivating and informative writing in the world news category. My expertise covers a range of industries, including tourism, technology, forex and stocks. From brief social media posts to in-depth articles, I am dedicated to creating compelling content for various platforms.


