
- GBP/USD is experiencing a downward pullback on Wednesday.
- UK data was weaker than expected, capping gains for the Pound.
- UK retail sales will be released on Friday.
GBP/USD is pulling back after touching the 1.2500 area and retesting the 1.2400 area after UK data was not as expected and US numbers were mixed.
The UK core Consumer Price Index (CPI) for the year to October stood at 5.7%, slightly below the 5.8% expected and further away from the previous month’s reading of 6.1%.
The UK consumer price index for the same period also beat expectations, at 6.1% versus 6.4% forecast and down from 8.9% previously.
In the United States, the underlying Producer Price Index (PPI) for the annualized period in October was 2.4%, below the 2.7% forecast. Meanwhile, US retail sales also fell, but remained above expectations.
US retail sales for October fell a slight 0.1%, above the forecast of -0.3%, but still below the previous month’s 0.9%, which was revised up from 0.7%.
UK Retail Sales will be released on Friday, and sterling traders will be keeping an eye on the latter part of the week.
GBP/USD Technical Outlook
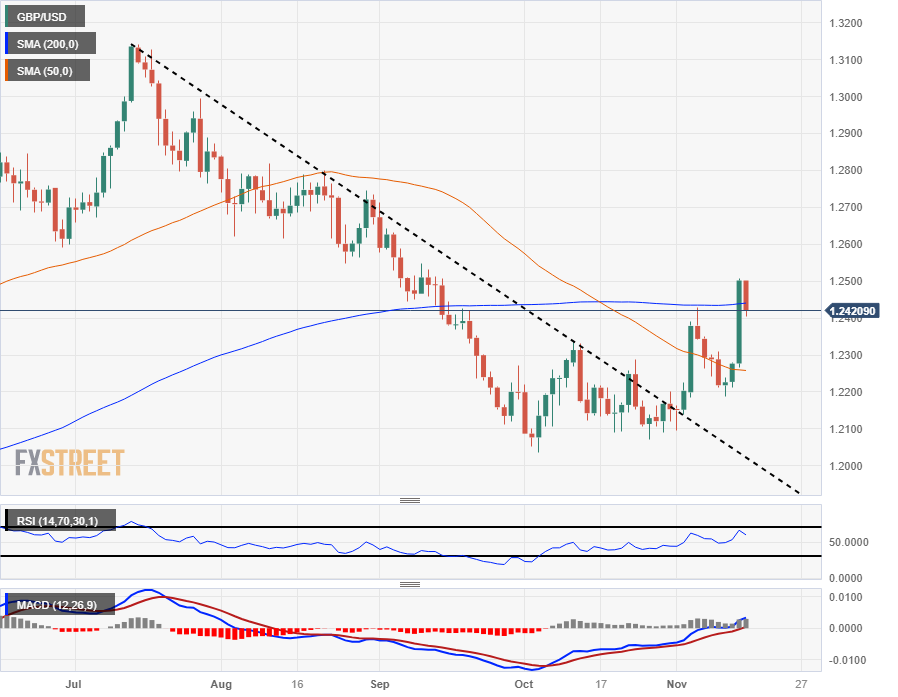
The GBP/USD pair is getting stuck at the 200-day moving average (SMA) after facing strong rejection from the 1.2500 area, and the pair’s bullish bounce from 1.2200 is quickly coming under pressure.
The bids are being supported by a bullish break of the descending trend line drawn from the July peak near 1.3140, as well as the 50-day SMA currently rotating out of a descending pattern near 1.2260.
The medium-term floor for any bearish pullback will be the October bid lows, just above the 1.2000 level, as well as a rough support zone near 1.2100.
GBP/USD Daily Chart
GBP/USD Technical Levels
Source: Fx Street
I am Joshua Winder, a senior-level journalist and editor at World Stock Market. I specialize in covering news related to the stock market and economic trends. With more than 8 years of experience in this field, I have become an expert in financial reporting.


