
The analytical company Glassnode has released a powerful new on-chain analysis tool – the Cycle Extremes indicator. It will help determine when the Bitcoin market is at its peak or bottom.
Market participants already have a variety of instruments at their disposal, which can be considered individually or in combination. However, bringing the numerous components and factors of the Bitcoin market into a single metric allows you to identify potential peaks and lows more accurately. The new indicator from Glassnode aims to do just that. It does not rely on one set of on-chain data, but combines several fundamental metrics into one synergistic whole.
#Bitcoin Confluence is your friend.
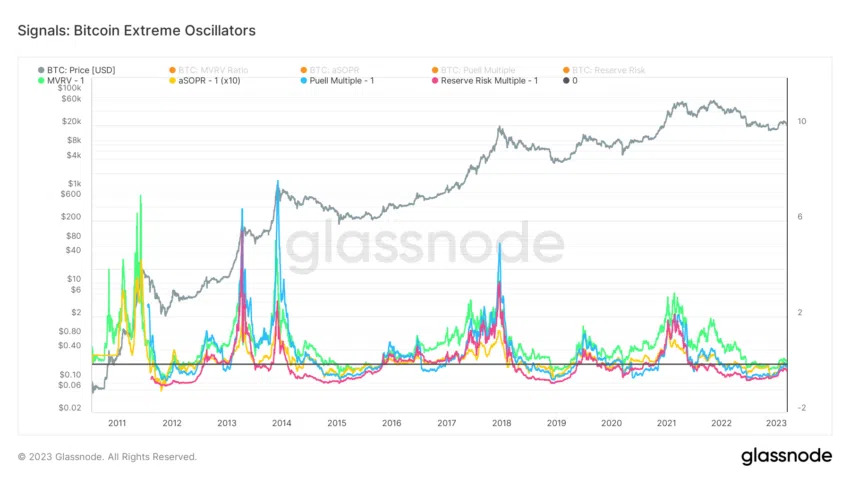
This WIP tool seeks +/- 1-standard deviation extremes across four popular on-chain oscillators:
— 🟢MVRV Ratio
— 🟡Puell Multiple
— 🔵aSOPR
— 🔴Reserve RiskSignal is designed to fire off when at least 3-of-4 of the signals are at an extreme. pic.twitter.com/uYljFFLgEN
— _Checkɱate 🔑⚡🌋☢️🛢️ (@_Checkmatey_) March 4, 2023
The basic version of the indicator was recently presented Glassnode Lead Analyst on Twitter. The instrument also has a second version with oscillators.
The indicator determines the peaks and lows of the bitcoin market
On-chain analysis is designed to quantify the behavior of investors using various criteria, categories and metrics, such as activity, profit and loss, or coin holding period.
The new indicator from Glassnode takes into account four of the most popular metrics that have historically shown high accuracy in determining the peaks and lows of BTC cycles. It measures the standard deviation from the extremes of the following oscillators:
- MVRV Ratio (green) – shows unrealized profit/loss for the entire market
- aSOPR (yellow) – measures extreme levels of realized gains/losses
- Puell Multiple (blue) – shows the relative income and profitability of BTC miners
- Reserve risk (red) – measures the number of long-term coin holders
The tool determines the peak or bottom of the Bitcoin market when at least 3 out of 4 of its components merge. In the event of an extreme cooling of the market, it generates a blue signal. A yellow signal indicates overheating and usually appears at the end of a bullish cycle.
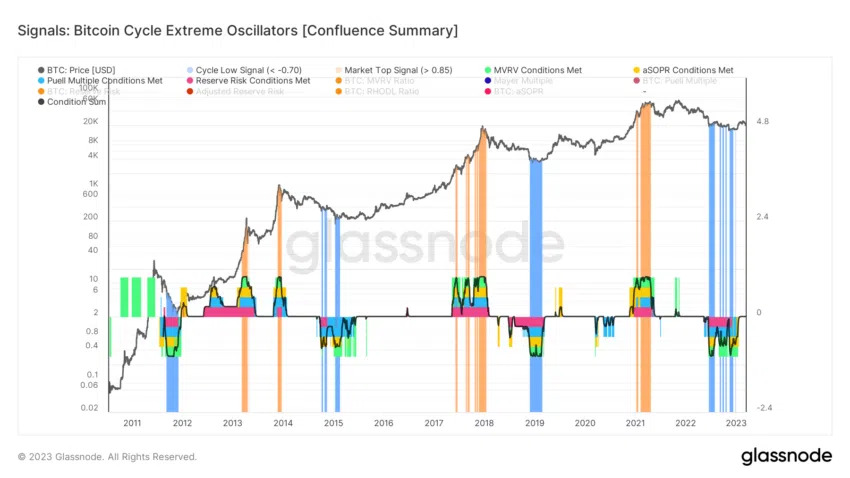
The chart shows that the extremes of the ongoing bear market appeared in mid-June 2022 and disappeared in early 2023 along with the rise in the price of bitcoin to $25,000. It is worth noting that the recent drop below $20,000 did not form a new signal.
Should we trust his testimony?
None of the past bearish cycles have been accompanied by blue signals for such a long period of time as this one. In addition, blue signals have never been so dispersed – only the 2014-2015 markets resemble the structure of the current cycle bottom.
Regardless of the fate of bitcoin, it is worth watching new on-chain tools from time to time. After all, the growing complexity of the cryptocurrency sector requires a global perspective and analytical innovation. At the same time, you should not succumb to the illusion of the existence of a single, magical indicator that never makes a mistake.
Source: Cryptocurrency
I am an experienced journalist and writer with a career in the news industry. My focus is on covering Top News stories for World Stock Market, where I provide comprehensive analysis and commentary on markets around the world. I have expertise in writing both long-form articles and shorter pieces that deliver timely, relevant updates to readers.


