
- The gold price sank to a new two-and-a-half-year low at $1,638.90.
- Global PMI releases in the EU, UK and US sparked investors’ recession fears, increasing appetite for the safe-haven US dollar.
- Gold Price Analysis: A break below $1,638 will send XAU/USD towards $1,600.
the price of gold falls to a new two-and-a-half-year low, hit by risk-off sentiment and flows into the US dollar, which hit new two-decade highs. In general, the strength of the US dollar and the increase in US Treasury bond yields are two reasons for the decline of the complex of precious metals, mainly the yellow metal. At the time of writing, XAU/USD is trading at $1,643.50 a troy ounce.
US stocks fell as Wall Street closed Friday with heavy losses of between 1.62% and 1.80%. The interest rate on the US 10-year Treasury bond yield fell to 3.829% and will end the week below the 3.70% threshold. Likewise, the yield on the 10-year inflation-protected US Treasury bonds (TIPS) weighed on the non-yielding metal, which will end at 1.33%.
Meanwhile, the greenback continues to refresh 20-year highs, with the US Dollar Index at 112.990, up 1.55%, after hitting a yearly high of 113.228.
The Federal Reserve’s decision on Wednesday, which raised interest rates by 0.75% and opened the door for another 120 basis point hike, reignited recession fears in the United States. A series of measures of global business activity revealed during the day forecast a recession in the euro zone and the United Kingdom. In the case of the US, the S&P global PMIs improved, although the Services and Composite readings remained in recession territory.
Sources quoted by Reuters commented: “Gold and the other semi-investment metals like silver and platinum will likely remain under pressure until the market peaks.”
On the other hand, XAU/USD started trading around the $1,670 area and rose to a daily high of $1,675.93. Later, prices for the yellow metal tumbled to a fresh daily low of $1,638.90.
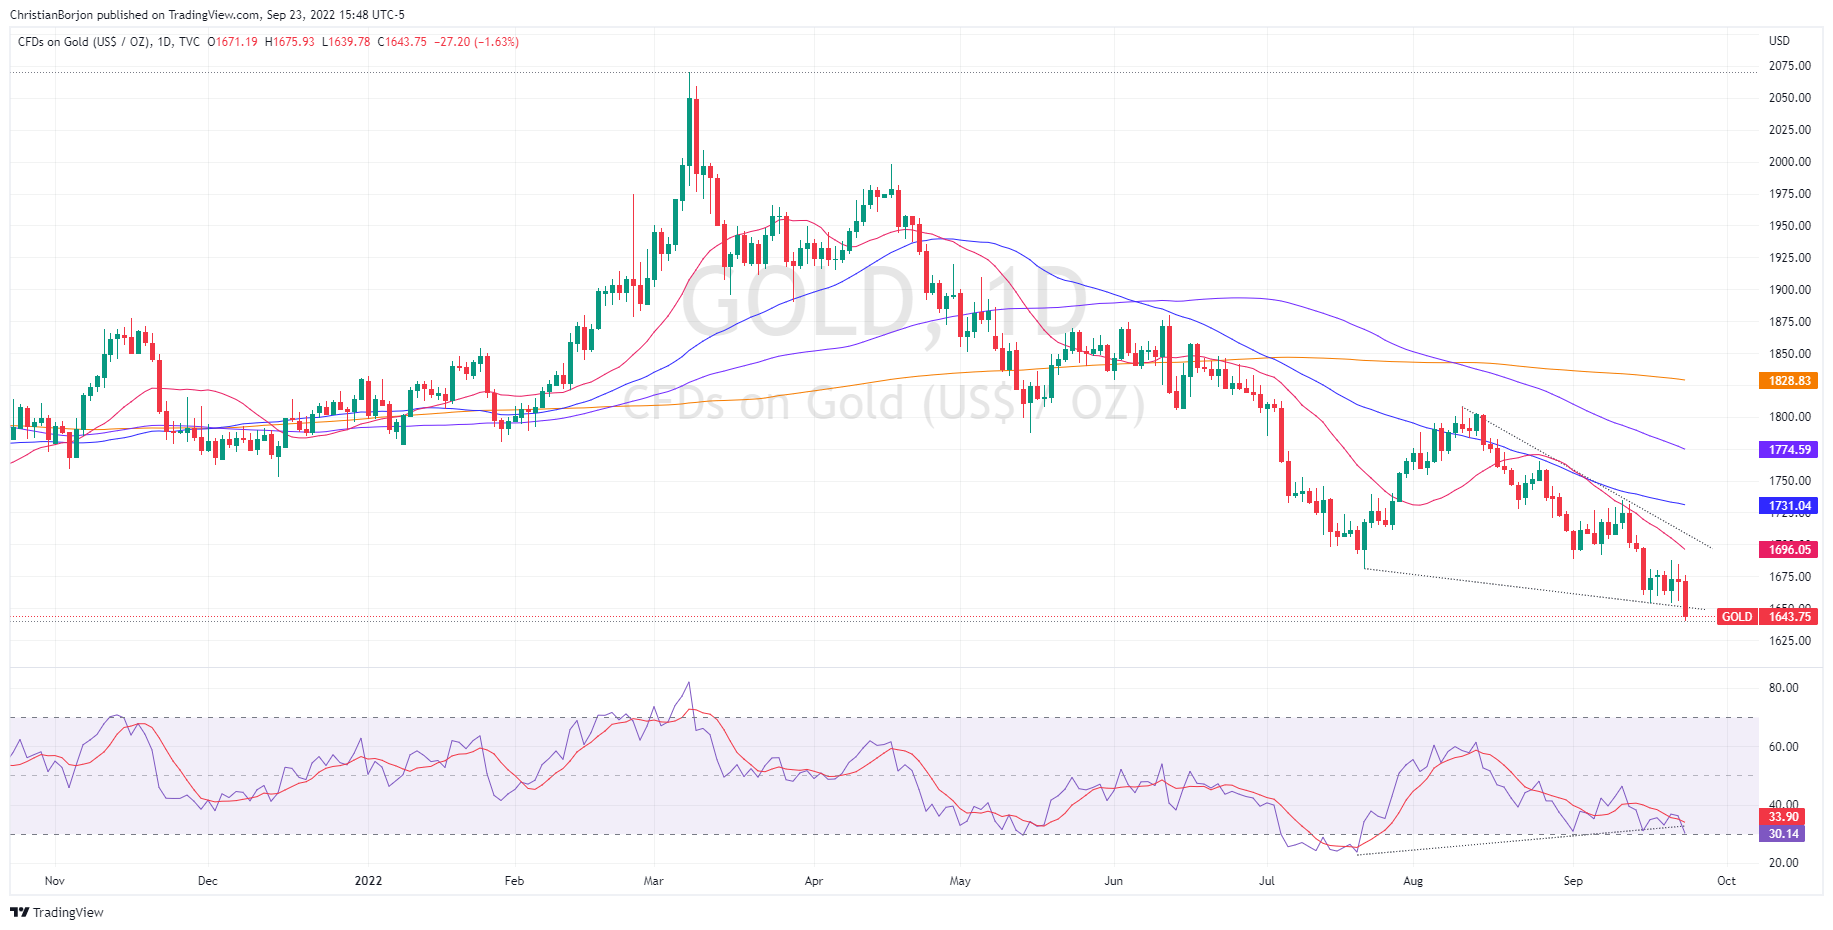
Gold Price Analysis (XAU/USD): Technical Outlook
The falling wedge that emerged on the daily chart of XAU/USD was invalidated when the price fell below the lower trend line. It is worth noting that although the RSI is about to indicate that gold is oversold, the downtrend for the yellow metal remains intact. Therefore, the first support for XAU/USD would be the yearly low at $1,638.90. Once broken, the next support for XAU/USD would be the psychological level of $1,600, followed by the March 2020 lows at $1,451.41.
Technical levels
Source: Fx Street
With 6 years of experience, I bring to the table captivating and informative writing in the world news category. My expertise covers a range of industries, including tourism, technology, forex and stocks. From brief social media posts to in-depth articles, I am dedicated to creating compelling content for various platforms.


