
- Last week’s strong report on the US labor market justified further action by the Federal Reserve.
- Money market futures point to a 50 basis point rate hike for the May meeting.
- Gold Price Analysis: Neutral with downside risk.
The fall in the price of gold It is stalling as the bulls entered the market at last Friday’s low of around $1,860 and rallied back to $1,870. The staggering US non-farm payrolls report and rallying markets ahead of further interest rate hikes boosted demand for the dollar, a headwind for the underperforming metal. At the time of writing, XAU/USD is trading at $1,868.77, up half a percentage point.
Gold pressured by expectations of a hawkish Fed and a strong dollar
Wall Street continued to stumble after the US Department of Labor revealed that the United States (US) economy added more than 500,000 jobs to the economy, while the unemployment rate fell to a low minimum of 53 and a half years of 3.4%. This reignited the spark that the US Federal Reserve (Fed) may have to raise rates, above market expectations, with traders anticipating a rate cut in the second half of 2023.
The World Interest Rate Probabilities (WIRP) suggest 50 basis points for the next two meetings, while the odds stand at 90% for the June meeting. Thus, the federal funds rate target would be between 5% and 5.25%, according to the December FOMC dot charts.
Meanwhile, the Dollar Index, a gauge of the dollar’s value against its peers, is up 0.50% to 103.519, halting a rally in Gold, along with US Treasury yields at 10-year, which rises nine basis points (bp), to 3,616%.
Gold traders’ attention focused on Federal Reserve Chairman Jerome Powell’s interview at the Economic Club of Washington, along with the Balance of Trade and President Joe Biden’s State of the Union address to Congress. from the US on Tuesday.
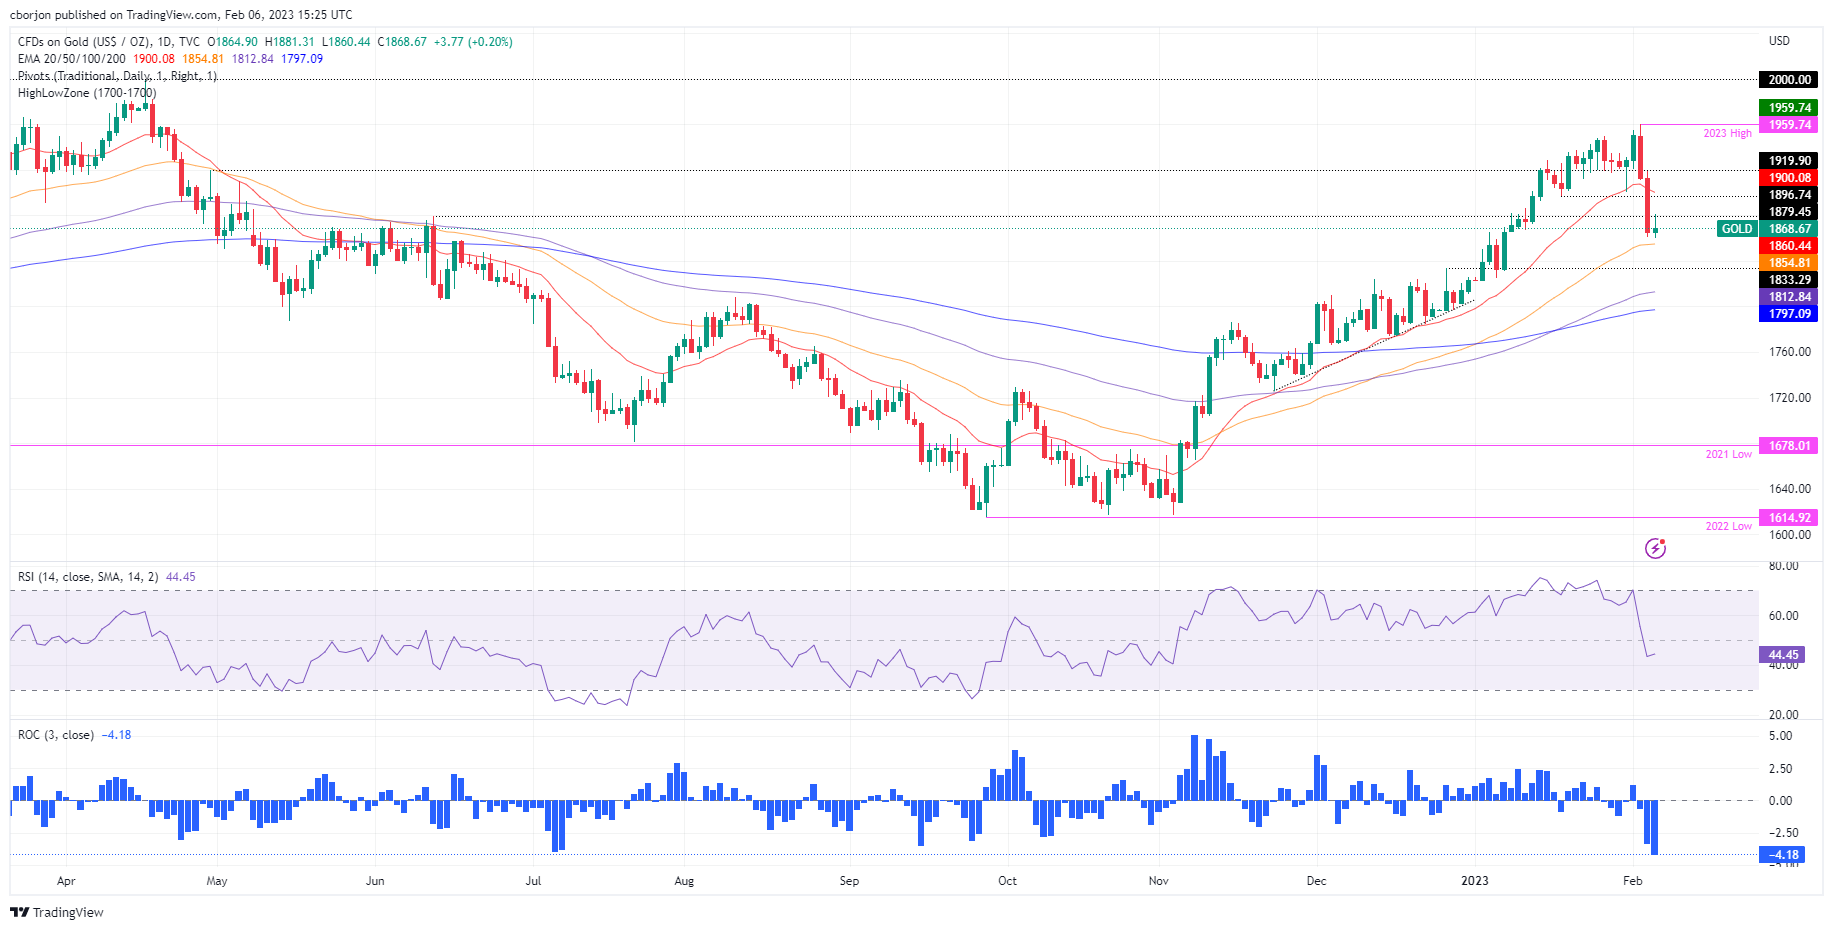
Gold Price Analysis: XAU/USD Technical Outlook
Technically, the XAU/USD pair was around $1,860, far from testing the 50-day EMA at $1,854.87. Although the yellow metal reached a daily high of $1,881.31, the risks are skewed to the downside. Supporting the above is the Relative Strength Index (RSP) collapses into bearish territory, while the Rate of Change (RoC) portrays sellers gaining momentum.
Therefore, the first support for XAU/USD would be the February 6 low at $1,860.44. A break below would expose the 50 day EMA at $1,854.85, followed by the 100 day EMA at $1,812.85, before the psychological level of $1,800.
Source: Fx Street
I am Joshua Winder, a senior-level journalist and editor at World Stock Market. I specialize in covering news related to the stock market and economic trends. With more than 8 years of experience in this field, I have become an expert in financial reporting.


