
- Gold remains dovish, though just above its opening price, ahead of the Fed meeting.
- Last week’s US data justifies the Fed holding back the magnitude of interest rate hikes.
- Gold Price Preview: Swinging trade, mostly sideways, with traders on the sidelines awaiting Fed decision.
the price of gold It is trading mostly sideways as investors prepare for the US Federal Reserve’s Open Market Committee (FOMC) meeting, which begins on Tuesday. Most analysts estimate that the US Federal Reserve (Fed) would raise rates by 25 basis points, although they will be watching for signs of future meetings. Therefore, XAU/USD is trading at $1,928.45 per troy ounce at the time of writing.
The US fourth quarter GDP supports the Fed’s decision to raise 25 basis points
Wall Street opened mixed on the eve of an important week for the United States (US) economy. Last week’s data, led by the publication of the advanced Gross Domestic Product (GDP) for the fourth quarter, stood at 2.9%, above estimates of 2.6% qoq, which portrays a strong economy. However, it slowed down from 3.2% in the third quarter, as confirmed by data from the US Department of Commerce. That being said, financial analysts have priced in a 25 basis point increase in the US Federal Funds Rate (FFR).
The Fed’s measure of inflation, core personal consumption spending, stumbles for four straight months.
Another reason that justifies downward movements is inflation. The Fed’s preferred inflation gauge, Core Personal Consumption Expenditure (PCE), came in at 4.4% year-on-year, in line with estimates, but down from 4.7% in November. Inflation has fallen for four straight months, supporting some Fed officials, who have expressed the need to slow the pace of rate hikes but have insisted no rate cuts are expected in 2023.
University of Michigan Consumer Sentiment improved and inflation expectations fell
In addition, inflation expectations reported by a University of Michigan (UoM) survey portrayed that US consumers expected high prices to fall. One-year inflation is expected at 3.9%, while for a 5-year horizon, it would fall from 3% to 2.9%. Consumer Sentiment also improved, going from 59.7 to 64.9 in January.
Against this background, a pause by the Fed in its tightening cycle could bolster demand for Gold. Furthermore, if US Treasury Yields start to decline, this would weaken the US dollar and boost XAU/USD. , which could recover towards the $2,000 sign.
As of this writing, US Treasury yields are up three basis points (bp) to 3.535%, while the US dollar is largely unchanged. The Dollar Index (DXY), which measures the value of the dollar against a basket of currencies, rose 0.01% to 101,930.
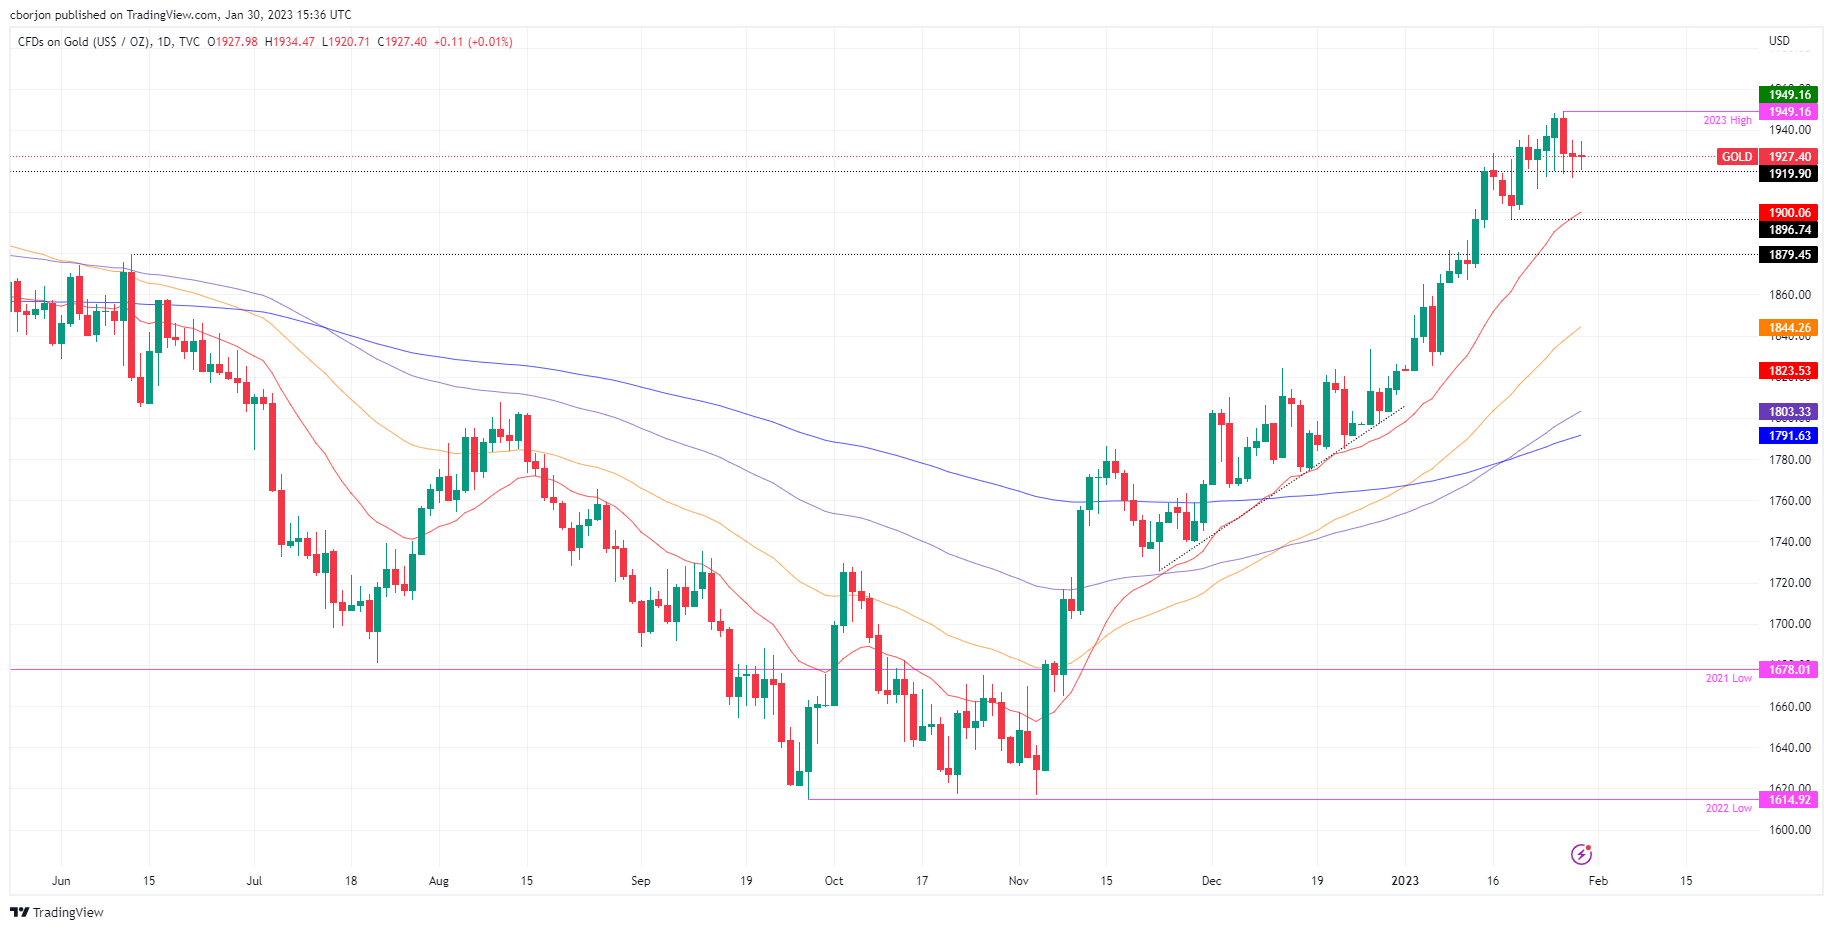
Gold Price Analysis: Technical Outlook
XAU/USD remains subdued, influenced by fundamentals. After hitting a high of $1,949.16, Gold fell towards $1,916.72 last Friday, and prices remain trapped within the $1,920-35 range. Also, oscillators such as the Relative Strength Index (RSI) and the Rate of Change (RoC) are slightly skewed to the downside, but the RSI remains in bullish territory.
If XAU/USD extends its gains above the top of the range, the next stop would be the yearly high at $1,949.16, followed by the psychological level of /$2,000. On the other hand, if the XAU/USD were to break the support, the yellow metal would fall towards $1,900, followed by the 20-day EMA at $1,899.75, and then the low of May 18. January at $1,896.74.
Source: Fx Street
I am Joshua Winder, a senior-level journalist and editor at World Stock Market. I specialize in covering news related to the stock market and economic trends. With more than 8 years of experience in this field, I have become an expert in financial reporting.


