
- Gold rises after US Consumer Price Index data for June came in lower than expected.
- The data indicates a high probability of a rate cut in September, which is positive for Gold.
- Gold gains further after Powell strikes a cautiously optimistic tone in testimony before lawmakers in Washington.
He Gold (XAU/USD) Gold is trading above $2,400 on Thursday following the release of US Consumer Price Index (CPI) data for June, which shows easing price pressures. The lower-than-expected CPI data makes it more likely that the Federal Reserve (Fed) will see fit to cut short-term interest rates, which is positive for Gold as lower interest rates reduce the opportunity cost of holding the non-yielding asset.
Gold is also benefiting from emerging data showing that central banks continue to accumulate around the world. This is despite news on Sunday that the largest consumer of gold, the People’s Bank of China (PBoC), stopped buying the precious metal for the second consecutive month in June, following an 18-month buying bonanza.
Gold soars after US CPI release
Gold is up on Thursday after the release of US CPI data, which paints a picture of a cooling economy, suggesting that US interest rates will fall, which in turn will make gold a more attractive investment.
The U.S. CPI rose 3.0% year-over-year in June, below estimates of 3.1% and 3.3% in the previous month. The CPI declined 0.1% month-over-month in June, when economists were expecting a 0.1% increase from 0.0% in May, according to the U.S. CPI index. Data of the U.S. Bureau of Labor Statistics
Core CPI, which excludes the volatile food and energy components, meanwhile, cooled to 3.3%, below expectations of 3.4% from 3.4% previously. On a monthly basis, core CPI rose 0.1%, below the 0.2% forecast and 0.2% in May.
The data is further evidence that inflation is falling towards the Fed’s 2.0% target and makes it more likely that the central bank will begin cutting interest rates, a positive development for gold.
Gold rises as Powell takes middle-of-the-road approach, markets see cuts on horizon
Gold rose on Wednesday after markets assessed Fed Chairman Jerome Powell as cautiously optimistic on his second day of testimony before US lawmakers in Washington.
In comments to the House Financial Services Committee, Powell said, “We view current Fed policy as restrictive,” indicating that at their current level, interest rates were doing the job of reducing inflation to the Fed’s 2.0% target.
Asked about the timing of future Fed interest rate cuts and whether he would wait for the personal consumption expenditures (PCE) price index — the Fed’s preferred measure of inflation — to fall below the Fed’s target before acting, Powell said he would not, because “inflation has some momentum” and “you don’t want to wait until inflation is all the way down to 2.0%.” In his latest reading, both the headline and core PCE fell to 2.6%, suggesting the Fed may not be that far away from making rate cuts.
This reinforced current market-based barometers of when the Fed will cut interest rates. The CME FedWatch tool continues to see a high probability of 70% of a 0.25% cut in the Federal Funds rate – the Fed’s main policy rate – in September. Such a cut would take the policy rate to an upper bound of 5.25%. The CME FedWatch tool bases its probability on the price of 30-day Federal Funds futures.
While investors were awaiting more concrete details on when the Fed would cut interest rates, Powell’s general optimism about achieving a “soft landing” for the economy — when inflation returns to target without unemployment rising too much — boosted sentiment. That said, Friday’s official jobs report, the Nonfarm Payrolls release, reported that the U.S. unemployment rate rose to 4.1% from 4.0%, when no increase was expected. It was the third straight month of increases.
Gold boosted by central bank purchases
Gold made further gains on Thursday as data emerged showing that central banks around the world continued to accumulate gold despite news that the largest consumer, the People’s Bank of China (PBoC), has stopped gold purchases for two consecutive months in June.
Despite the absence of the PBoC from the market, which accounts for more than a quarter of purchases, the Bank of India (BOI) bought nine tonnes of gold in June, the National Bank of Poland four tonnes and the Czech National Bank two tonnes, according to TD Securities.
Citibank analysts remain optimistic about central bank demand, which they see rising in the second half of the year to reach a total of around 1,100 tonnes in 2024, up 5.8% from a year earlier. They attribute the gains to a growing likelihood of trade wars and concerns about US fiscal policies.
In this regard, Citibank’s official forecast is that Gold will reach $2,600 by the end of 2024.
Meanwhile, Bert Melek, Head of Commodity Strategy at TD Securities, forecasts that Gold will hit $2,475 in the first quarter of 2025.
Technical Analysis: Gold rises for the third consecutive day
Gold is gaining for the third consecutive day after a two-bar bearish reversal pattern (green shaded rectangle in the chart below) formed at the top of the early July bullish move. This pattern forms after a long green up day followed by a long red down day of similar length and size. It may be a signal of a short-term reversal. In the case of Gold, this has not materialized.
XAU/USD Daily Chart
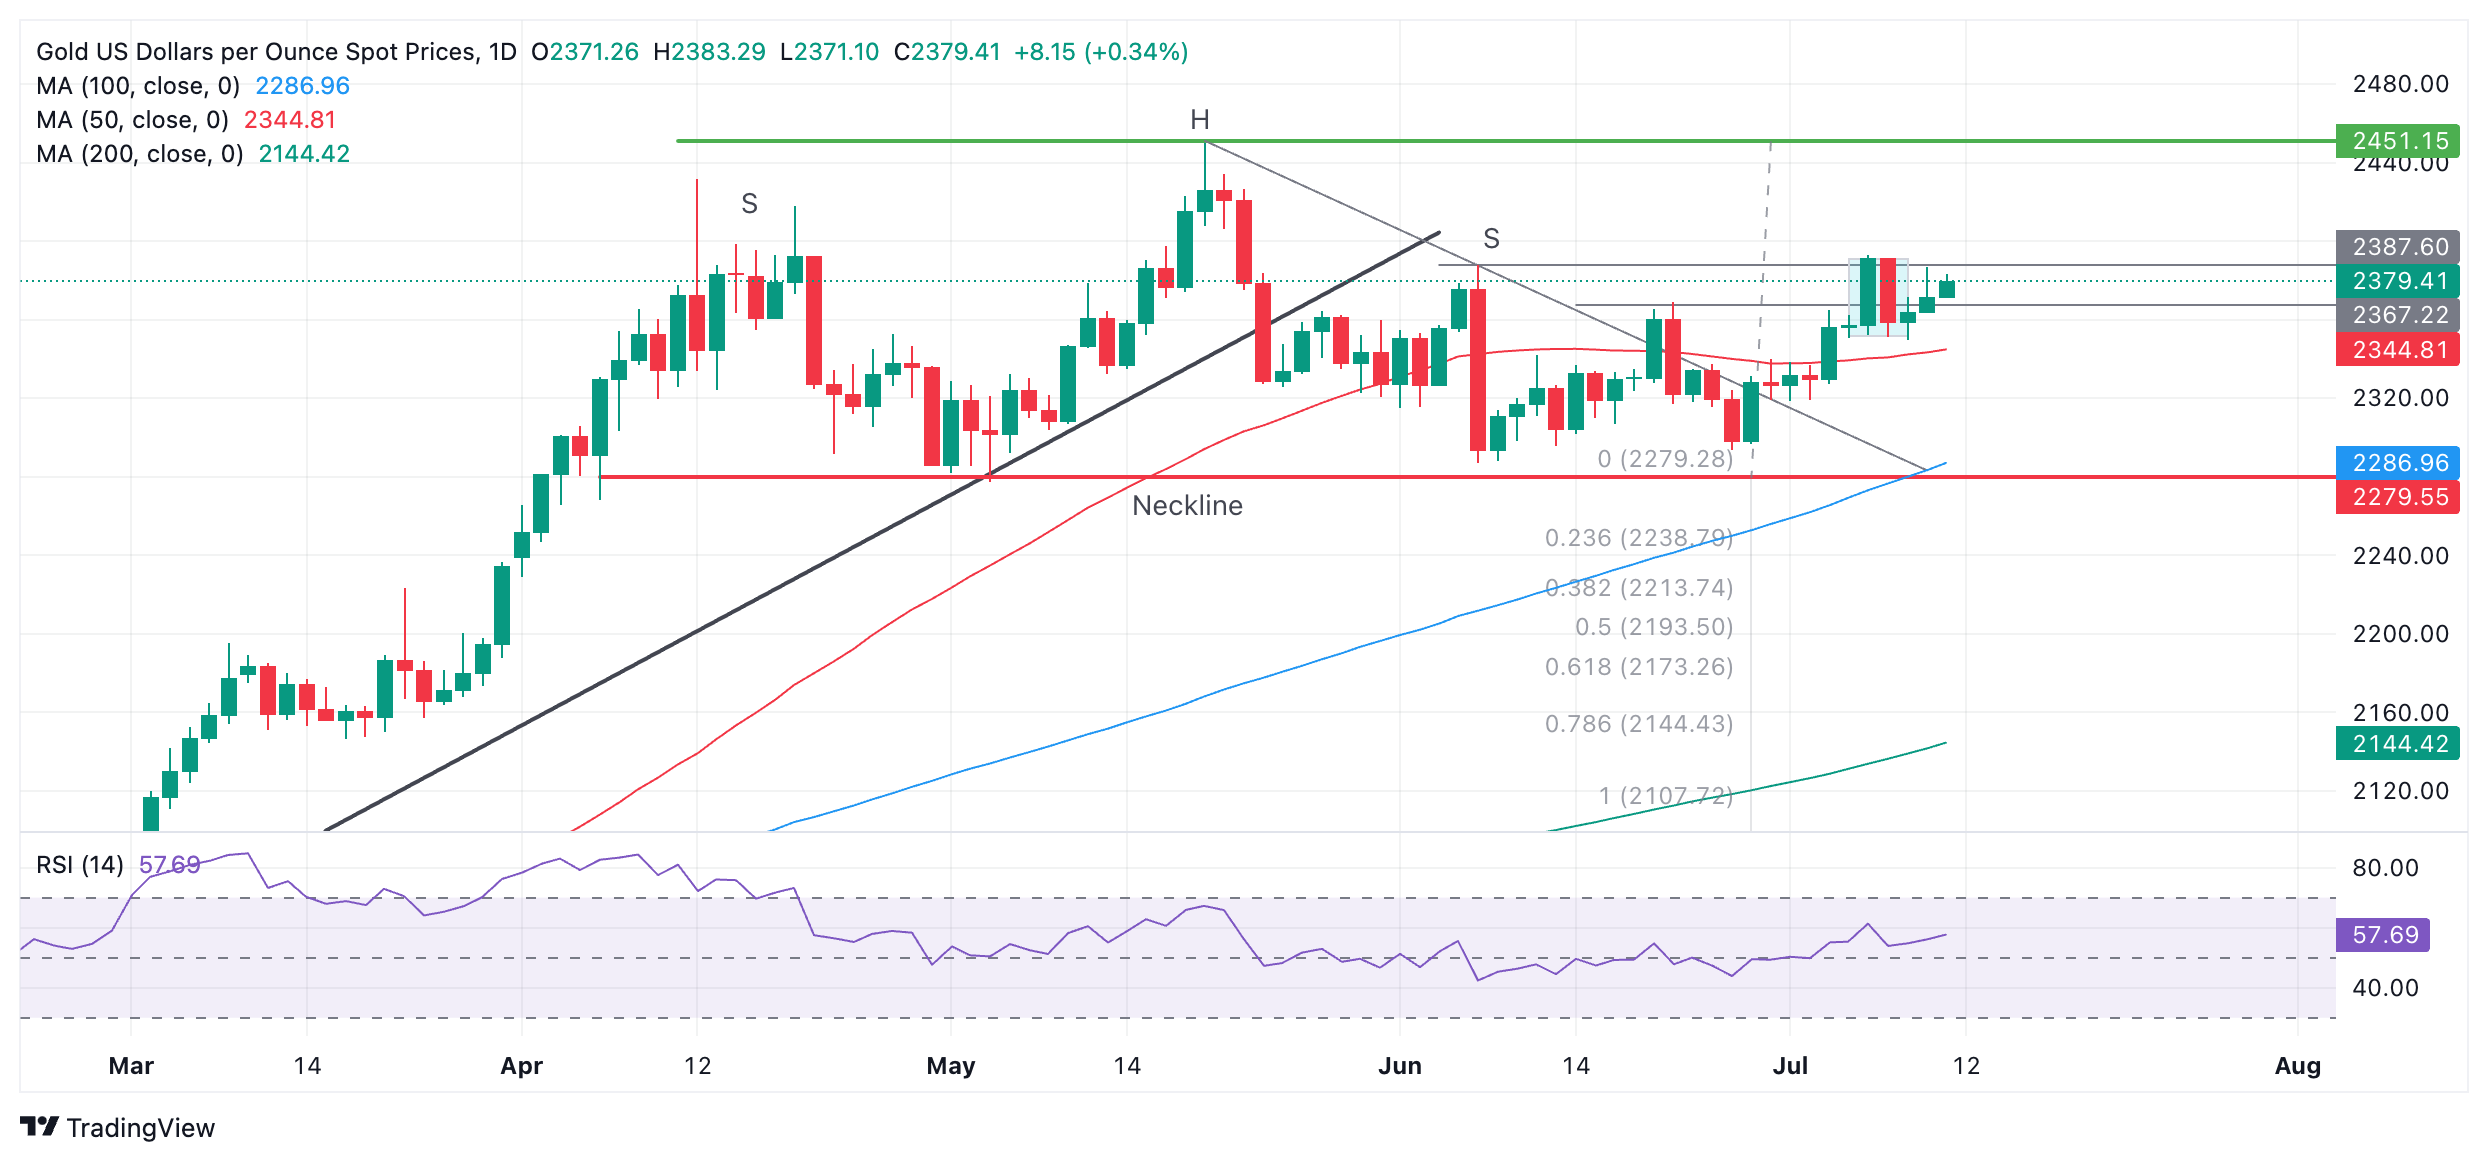
The outlook is uncertain. There is still a risk that Gold could retrace to the 50-day simple moving average (SMA) at $2,344, fulfilling the negative implications of the two-bar pattern. At the same time, the recovery after its formation has partially invalidated it and suggests that the price could rise further.
A break above the pattern high and Friday’s peak at $2,393 would provide strong bullish confirmation of an upside continuation. This would likely also unlock the next target at the all-time high of $2,451.
The bearish head and shoulders pattern that formed from April to June has been invalidated by the recent rally. However, there is still a chance – albeit much smaller – that a more complex top pattern has formed in its place.
If a complex pattern has formed in place of the H&S, and price breaks below the pattern’s neckline at $2.279, a downside reversal could still be possible with a conservative target at $2.171, the ratio of 0.618 of the pattern’s height extrapolated to the downside.
The trend is now sideways in both the short and medium term. In the long term, Gold remains in an uptrend.
Economic indicator
Consumer Price Index (YoY)
The CPI is published on US Labor Department and measures price movements by comparing retail prices of a representative basket of goods and services. The purchasing power of the dollar is diminished by inflation. The CPI is a key indicator for measuring inflation and purchasing trends. A reading above expectations is bullish for the dollar, while a reading below expectations is bearish.
Latest Post: Thu Jul 11, 2024 12:30 PM
Frequency: Monthly
Current: 3%
Dear: 3.1%
Previous: 3.3%
Fountain: US Bureau of Labor Statistics
The US Federal Reserve has a dual mandate of maintaining price stability and maximum employment. According to this mandate, inflation should be around 2% YoY and has become the weakest pillar of the central bank’s directive ever since the world suffered a pandemic, which extends to these days. Price pressures continue to rise amid supply-chain issues and bottlenecks, with the Consumer Price Index (CPI) hanging at multi-decade highs. The Fed has already taken measures to tame inflation and is expected to maintain an aggressive stance in the foreseeable future.
Source: Fx Street
I am Joshua Winder, a senior-level journalist and editor at World Stock Market. I specialize in covering news related to the stock market and economic trends. With more than 8 years of experience in this field, I have become an expert in financial reporting.


