
- The price of Natural Gas consolidates the strong rise of the previous day.
- The technical situation favors the bulls and supports the prospects for further increases.
- A break below the $2.640-$2.6375 confluence would negate the positive trend.
The price of Natural Gas struggles to capitalize on the previous day’s strong recovery from the $2.8520 area and oscillates within a tight range at the start of the European session on Tuesday. XNG/USD remains below more than a month’s highs, around the $3.0350 area touched last Friday, although the technical setup suggests the path of least resistance is to the upside.
The recent repeated bounce from the 100-day SMA and sustained strength above the all-important 200-day SMA favor the bulls. Furthermore, the technical indicators on the daily chart remain comfortably in positive territory and are still far from the overbought zone. This, in turn, validates the positive near-term outlook for XNG/USD and supports the prospects of a further appreciation move.
Some continuation buying above the psychological level of $3,000 will reaffirm the constructive setup and lift XNG/USD to the next relevant hurdle near the $3.1875 area. This zone represents the upper limit of a several-month-old ascending trend channel that, if decisively broken, will signal a new breakout and pave the way for further gains.
On the other hand, the $2.8520 area, the 200-day SMA, could continue to protect the immediate decline. A convincing break below that level will expose the monthly low, around the $2.7150 area, before XNG/USD falls to the confluence of $2.6400 and $2.6375. This latter zone comprises the 100-day SMA and uptrend channel support, which if broken decisively could shift the short-term bias in favor of the bears and trigger aggressive selling.
XNG/USD daily chart
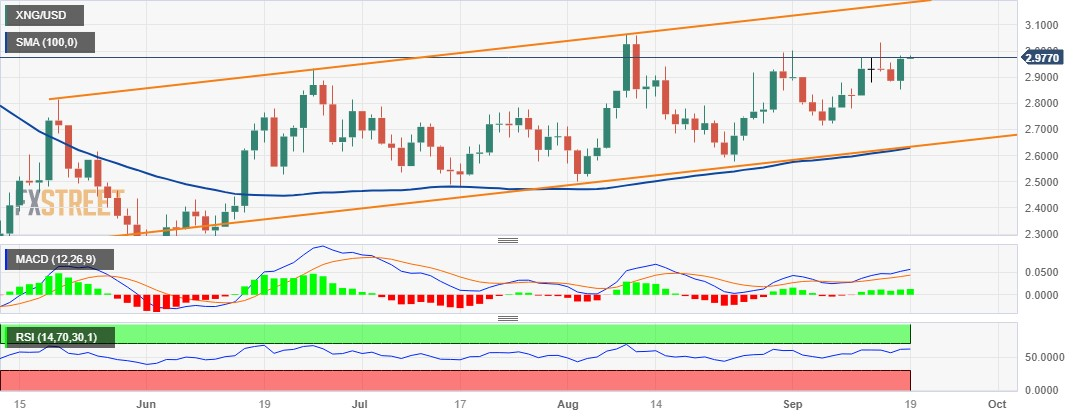
Source: Fx Street
I am Joshua Winder, a senior-level journalist and editor at World Stock Market. I specialize in covering news related to the stock market and economic trends. With more than 8 years of experience in this field, I have become an expert in financial reporting.


