
- Silver price attracts some buying at lower levels on Tuesday and climbs back to a near two-week high.
- The mixed technical setup advises caution before opening aggressive directional positions.
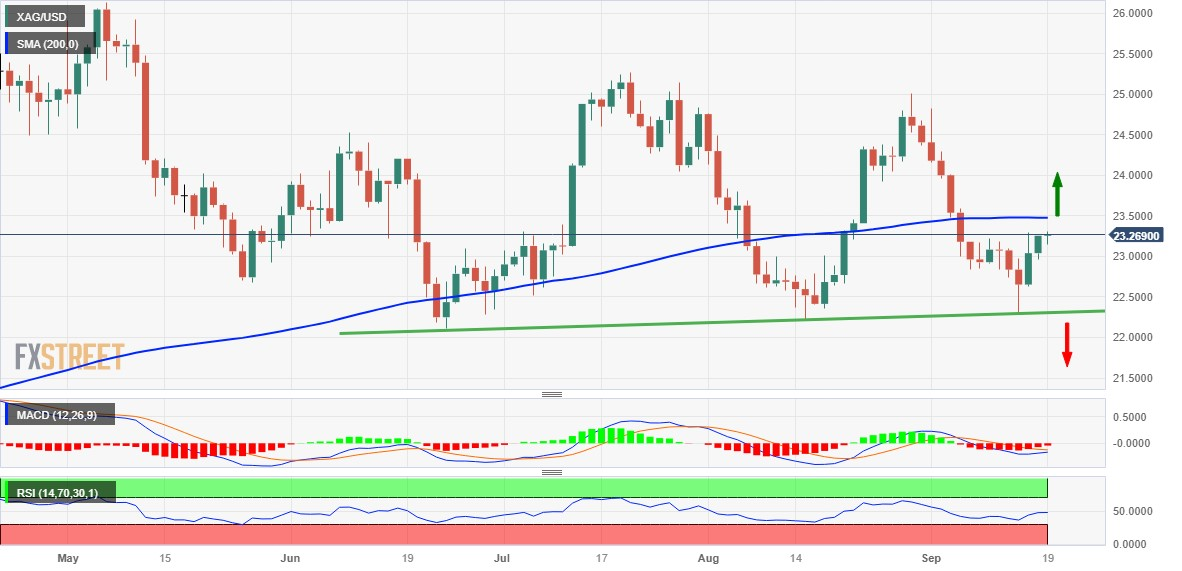
- The 200-day SMA is likely to limit gains and act as a key point.
The price of Silver (XAG/USD) reverses modest intraday losses in the $23.15 area and is once again approaching the almost two-week high reached this Tuesday. The white metal is trading around the $23.25 zone during the early hours of the European session, practically unchanged on the day.
From a technical point of view, the oscillators on the daily chart – although they have recovered from lower levels – continue to remain in negative territory and favor the bears. That said, last week’s solid rebound from the $22.30 support zone – which represents an ascending trend line extending from June’s monthly low – and subsequent strength warrant caution before positioning for further losses before of the FOMC’s key monetary policy decision on Wednesday.
Meanwhile, any significant decline is likely to find some support near the round $23.00 level, ahead of the $22.80 area and the $23.30 region, a nearly one-month low hit last Thursday. A convincing break below this last level will be seen as a new trigger for the bears and will make XAG/USD vulnerable to accelerate the decline towards the next relevant support near the $21.25 area. The bearish trajectory could extend further towards the $21.00 level.
On the other hand, momentum beyond the $23.30 area, the daily high, could face strong resistance and remain limited near the technically significant 200-day SMA, currently around the $23.45. However, a sustained breakout could change the trend in favor of the bulls. This, in turn, would allow XAG/USD to break through the 100-day SMA barrier near the $23.80 region and try to reclaim the $24.00 level.
The next major hurdle lies near the $24.30-$24.35 area, above which XAG/USD is likely to conquer the psychological level of $25.00. The latter coincides with the August monthly high and is closely followed by the July high, around the $25.25 region.
Daily Silver Price Chart
Silver additional technical levels
Source: Fx Street
I am Joshua Winder, a senior-level journalist and editor at World Stock Market. I specialize in covering news related to the stock market and economic trends. With more than 8 years of experience in this field, I have become an expert in financial reporting.


