
- NZD/JPY has been trading sideways recently, with a slightly bullish outlook.
- The RSI is in the positive area and rising, the MACD is flat and green.
- A break above 92.50 could confirm further upside potential.
The NZD/JPY pair resumed its upward trajectory on Monday, gaining 0.15% to 91.25. Since early October, the pair has been trading in a tight range, consolidating last month’s gains, but the 20-day, 100-day, and 200-day simple moving averages (SMAs) appear to be converging towards 92.50, which could signal that a test That level may be on the horizon.
The Relative Strength Index (RSI) is in the positive area and rising, indicating that buying pressure is strong. The MACD is flat and green, suggesting that the buying pressure is constant.
The price action has been contained within a tight range, and the pair has not made any significant spikes up or down. The technical outlook remains bullish, and a break above 92.50 could confirm further upside potential. Supports are seen at 90.00, 90.50 and 91.00, and resistances at 91.50, 92.00 (convergence of the 20, 100 and 200 day SMAs) and 92.50.
NZD/JPY daily chart
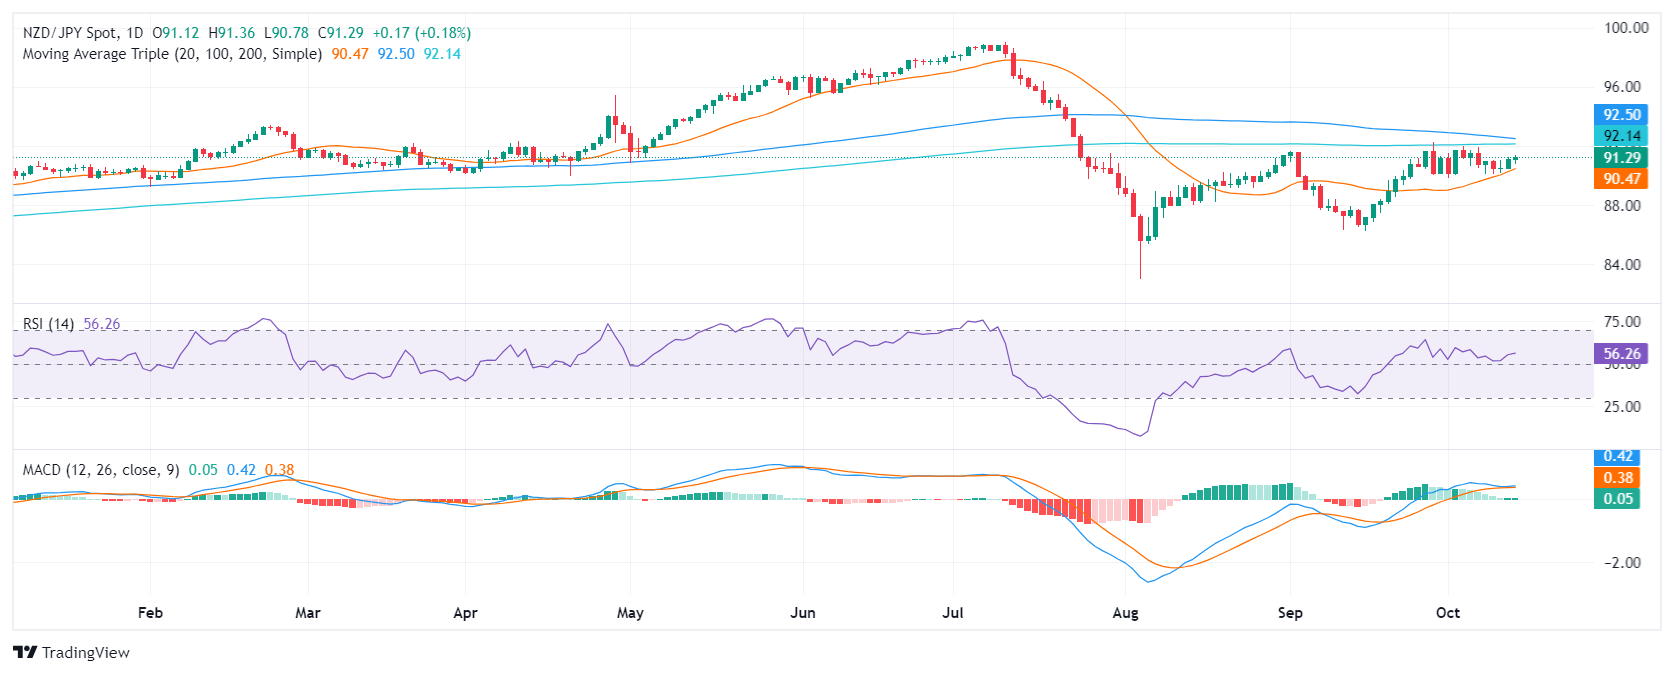
Source: Fx Street
I am Joshua Winder, a senior-level journalist and editor at World Stock Market. I specialize in covering news related to the stock market and economic trends. With more than 8 years of experience in this field, I have become an expert in financial reporting.


